Unknown entries from news log file:
First 10 / 10 lines (100.0%)
Log entries by program:
| Program name | Lines | %Lines | Size | %Size |
|---|---|---|---|---|
| nnrpd | 34641 | 77.5% | 3.5 MB | 71.6% |
| innd | 6239 | 14.0% | 1005.9 KB | 20.1% |
| inn | 2341 | 5.2% | 287.7 KB | 5.7% |
| innfeed | 1432 | 3.2% | 123.2 KB | 2.5% |
| controlchan | 22 | 0.0% | 4.8 KB | 0.1% |
| pgpverify | 1 | 0.0% | 0.1 KB | 0.0% |
| TOTAL: 6 | 44676 | 100.0% | 4.9 MB | 100.0% |
History cache:
| Reason | Count | %Count |
|---|---|---|
| Do not exist | 2332 | 68.8% |
| Negative hits | 1060 | 31.2% |
| Cache misses | 0 | 0.0% |
| Positive hits | 0 | 0.0% |
| TOTAL: 4 | 3392 | 100.0% |
INND timer:
| Code region | Time | Pct | Invoked | Min(ms) | Avg(ms) | Max(ms) |
|---|---|---|---|---|---|---|
| article cancel | 00:00:00.026 | 0.0% | 5 | 0.000 | 5.200 | 13.000 |
| article cleanup | 00:00:00.017 | 0.0% | 2334 | 0.000 | 0.007 | 1.000 |
| article logging | 00:00:00.039 | 0.0% | 2343 | 0.000 | 0.017 | 1.000 |
| article parse | 00:00:00.029 | 0.0% | 2848 | 0.000 | 0.010 | 1.000 |
| article write | 00:00:11.670 | 0.0% | 2076 | 0.000 | 5.621 | 138.000 |
| data move | 00:00:00.003 | 0.0% | 4274 | 0.000 | 0.001 | 0.500 |
| hisgrep/artcncl | 00:00:00.001 | 0.0% | 5 | 0.000 | 0.200 | 1.000 |
| history grep | 00:00:00.000 | 0.0% | 0 | 0.000 | 0.000 | 0.000 |
| history lookup | 00:00:20.631 | 0.0% | 3394 | 0.000 | 6.079 | 91.400 |
| history sync | 00:00:00.099 | 0.0% | 1609 | 0.000 | 0.062 | 23.000 |
| history write | 00:00:04.211 | 0.0% | 2334 | 0.000 | 1.804 | 31.000 |
| idle | 23:58:58.673 | 99.9% | 25414 | 848.648 | 3397.288 | 20209.000 |
| nntp read | 00:00:00.043 | 0.0% | 3939 | 0.000 | 0.011 | 1.000 |
| overview write | 00:00:01.273 | 0.0% | 2076 | 0.000 | 0.613 | 55.000 |
| perl filter | 00:00:06.845 | 0.0% | 2334 | 0.000 | 2.933 | 53.000 |
| python filter | 00:00:00.348 | 0.0% | 2334 | 0.000 | 0.149 | 10.000 |
| site send | 00:00:00.000 | 0.0% | 2 | 0.000 | 0.000 | 0.000 |
| TOTAL: 24:00:08.642 | 23:59:43.908 | 100.0% | - | - | - | - |
INNfeed timer:
| Code region | Time | Pct | Invoked | Min(ms) | Avg(ms) | Max(ms) |
|---|---|---|---|---|---|---|
| article new | 00:00:00.000 | 0.0% | 0 | 0.000 | 0.000 | 0.000 |
| article prepare | 00:00:00.000 | 0.0% | 0 | 0.000 | 0.000 | 0.000 |
| article read | 00:00:00.000 | 0.0% | 0 | 0.000 | 0.000 | 0.000 |
| backlog stats | 00:00:00.005 | 0.0% | 3743 | 0.000 | 0.001 | 0.500 |
| callbacks | 00:00:00.000 | 0.0% | 0 | 0.000 | 0.000 | 0.000 |
| data read | 00:00:00.000 | 0.0% | 3 | 0.000 | 0.000 | 0.000 |
| data write | 00:00:00.000 | 0.0% | 3 | 0.000 | 0.000 | 0.000 |
| idle | 23:59:00.028 | 100.0% | 3743 | 7515.375 | 23067.066 | 30100.500 |
| status file | 00:00:00.012 | 0.0% | 6 | 0.000 | 2.000 | 6.000 |
| TOTAL: 23:59:00.115 | 23:59:00.045 | 100.0% | - | - | - | - |
nnrpd timer:
| Code region | Time | Pct | Invoked | Min(ms) | Avg(ms) | Max(ms) |
|---|---|---|---|---|---|---|
| idle | 01:18:35.502 | 90.3% | 34575 | 21.000 | 136.385 | 10050.000 |
| newnews | 00:00:00.000 | 0.0% | 0 | 0.000 | 0.000 | 0.000 |
| nntpwrite | 00:00:00.776 | 0.0% | 80804 | 0.000 | 0.010 | 0.286 |
| TOTAL: 01:27:03.014 | 01:18:36.278 | 90.3% | - | - | - | - |
Control commands to INND:
| Command | Number |
|---|---|
| flush | 2 |
| flushlogs | 2 |
| go | 2 |
| logmode | 2 |
| lowmark | 1 |
| mode | 147 |
| name | 2 |
| pause | 2 |
| paused | 2 |
| reload | 2 |
| reserve | 2 |
| TOTAL: 11 | 166 |
Control Channel:
| Sender | newgroup | rmgroup | Other | Bad PGP | DoIt | OK |
|---|---|---|---|---|---|---|
| control@eternal-september.org | 0 | 0 | 1 | 0 | 0 | 1 |
| moderator@dana.de | 0 | 0 | 1 | 1 | 0 | 1 |
| TOTAL | 0 | 0 | 2 | 1 | 0 | 2 |
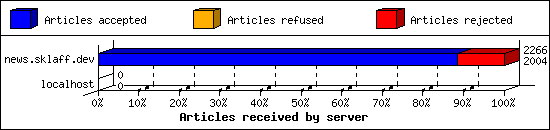
Incoming Feeds (INN):
| Server | Connects | Offered | Taken | Refused | Reject | %Accpt | Elapsed | |
|---|---|---|---|---|---|---|---|---|
| 1 | news.sklaff.dev | 3 | 2266 | 2004 | 0 | 262 | 88% | 23:32:31 |
| 2 | localhost | 25 | 0 | 0 | 0 | 0 | 0% | 00:00:00 |
| TOTAL: 2 | 28 | 2266 | 2004 | 0 | 262 | 88% | 23:32:31 | |
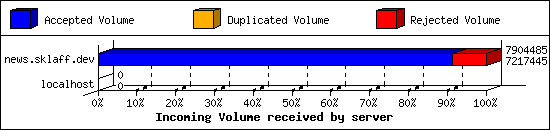
Incoming Volume (INN):
| Server | AcceptVol | DupVol | RejVol | TotalVol | %Acc | Vol/Art | |
|---|---|---|---|---|---|---|---|
| 1 | news.sklaff.dev | 6.9 MB | 0.0 KB | 670.9 KB | 7.5 MB | 91% | 3.4 KB |
| 2 | localhost | 0.0 KB | 0.0 KB | 0.0 KB | 0.0 KB | 0% | 0 |
| TOTAL: 2 | 6.9 MB | 0.0 KB | 670.9 KB | 7.5 MB | 91% | 3.4 KB | |
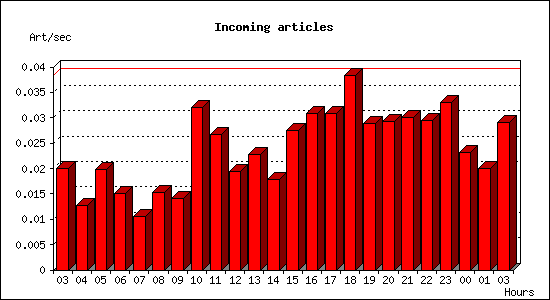
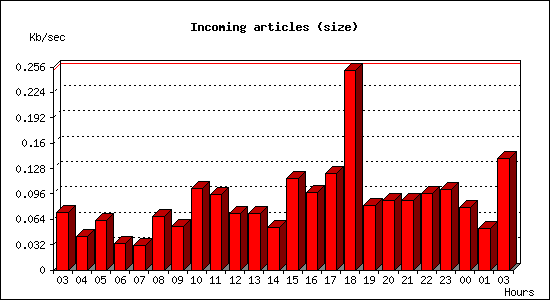
Incoming articles:
| Date | Articles | %Arts | Art/sec | Size | %Size | KB/sec |
|---|---|---|---|---|---|---|
| Sep 1 03:00:01 - 03:59:59 | 72 | 3.5% | 0.02 | 262.4 KB | 3.5% | 0.07 |
| Sep 1 04:00:00 - 04:59:59 | 46 | 2.2% | 0.01 | 151.7 KB | 2.0% | 0.04 |
| Sep 1 05:00:00 - 05:59:59 | 71 | 3.4% | 0.02 | 226.3 KB | 3.0% | 0.06 |
| Sep 1 06:00:00 - 06:59:59 | 54 | 2.6% | 0.01 | 122.5 KB | 1.6% | 0.03 |
| Sep 1 07:00:00 - 07:59:59 | 38 | 1.8% | 0.01 | 112.3 KB | 1.5% | 0.03 |
| Sep 1 08:00:00 - 08:59:59 | 55 | 2.7% | 0.02 | 240.6 KB | 3.2% | 0.07 |
| Sep 1 09:00:00 - 09:59:59 | 51 | 2.5% | 0.01 | 199.1 KB | 2.7% | 0.06 |
| Sep 1 10:00:00 - 10:59:59 | 115 | 5.5% | 0.03 | 368.7 KB | 4.9% | 0.10 |
| Sep 1 11:00:00 - 11:59:59 | 96 | 4.6% | 0.03 | 344.7 KB | 4.6% | 0.10 |
| Sep 1 12:00:00 - 12:59:59 | 70 | 3.4% | 0.02 | 258.1 KB | 3.5% | 0.07 |
| Sep 1 13:00:00 - 13:59:59 | 82 | 4.0% | 0.02 | 257.1 KB | 3.4% | 0.07 |
| Sep 1 14:00:00 - 14:59:59 | 64 | 3.1% | 0.02 | 191.0 KB | 2.6% | 0.05 |
| Sep 1 15:00:00 - 15:59:59 | 99 | 4.8% | 0.03 | 416.8 KB | 5.6% | 0.12 |
| Sep 1 16:00:00 - 16:59:59 | 111 | 5.3% | 0.03 | 353.8 KB | 4.7% | 0.10 |
| Sep 1 17:00:00 - 17:59:59 | 111 | 5.3% | 0.03 | 436.2 KB | 5.8% | 0.12 |
| Sep 1 18:00:00 - 18:59:59 | 138 | 6.7% | 0.04 | 904.8 KB | 12.1% | 0.25 |
| Sep 1 19:00:00 - 19:59:59 | 104 | 5.0% | 0.03 | 293.1 KB | 3.9% | 0.08 |
| Sep 1 20:00:00 - 20:59:59 | 105 | 5.1% | 0.03 | 314.3 KB | 4.2% | 0.09 |
| Sep 1 21:00:00 - 21:59:59 | 108 | 5.2% | 0.03 | 316.6 KB | 4.2% | 0.09 |
| Sep 1 22:00:00 - 22:59:59 | 106 | 5.1% | 0.03 | 348.2 KB | 4.7% | 0.10 |
| Sep 1 23:00:00 - 23:59:59 | 119 | 5.7% | 0.03 | 366.1 KB | 4.9% | 0.10 |
| Sep 2 00:00:00 - 00:59:59 | 83 | 4.0% | 0.02 | 285.2 KB | 3.8% | 0.08 |
| Sep 2 01:00:00 - 01:59:59 | 72 | 3.5% | 0.02 | 189.4 KB | 2.5% | 0.05 |
| Sep 2 02:00:00 - 03:00:01 | 105 | 5.1% | 0.03 | 505.5 KB | 6.8% | 0.14 |
| TOTAL: 24:00:00 | 2075 | 100.0% | 0.02 | 7.3 MB | 100.0% | 0.09 |
Sites sending bad articles:
| Server | Total | Group | Dist | Duplic | Unapp | TooOld | Site | Line | Other | |
|---|---|---|---|---|---|---|---|---|---|---|
| 1 | news.sklaff.dev | 266 | 0 | 0 | 0 | 0 | 0 | 0 | 0 | 266 |
| TOTAL: 1 | 266 | 0 | 0 | 0 | 0 | 0 | 0 | 0 | 266 | |
INND Perl filter [Top 20]:
| Reason | Count |
|---|---|
| Too many newsgroups | 181 |
| EMP (phl) | 32 |
| EMP (md5) | 29 |
| Too many newsgroups (meow) | 10 |
| HTML Multipart | 3 |
| User-issued cancel | 2 |
| TOTAL: 6 | 257 |
Miscellaneous innd statistics [Top 10]:
| Event | Server | Number |
|---|---|---|
| Including strange strings | ||
| news.sklaff.dev | 9 | |
| TOTAL: 1 | 9 | |
| TOTAL: 1 | 9 | |
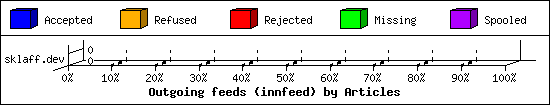
Outgoing Feeds (innfeed) by Articles:
| Server | Offered | Taken | Refused | Reject | Miss | Spool | %Took | Elapsed | |
|---|---|---|---|---|---|---|---|---|---|
| 1 | sklaff.dev | 0 | 0 | 0 | 0 | 0 | 0 | 0% | 00:10:00 |
| TOTAL: 1 | 0 | 0 | 0 | 0 | 0 | 0 | 0% | 00:10:00 | |
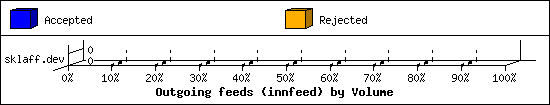
Outgoing Feeds (innfeed) by Volume:
| Server | AcceptVol | RejectVol | TotalVol | Volume/sec | Vol/Art | Elapsed | |
|---|---|---|---|---|---|---|---|
| 1 | sklaff.dev | 0.0 KB | 0.0 KB | 0.0 KB | 0.0 KB/s | 0 | 00:10:00 |
| TOTAL: 1 | 0.0 KB | 0.0 KB | 0.0 KB | 0.0 KB/s | 0 | 00:10:00 | |
NNRP readership statistics:
| System | Conn | Arts | Size | Groups | Post | Rej | Elapsed | |
|---|---|---|---|---|---|---|---|---|
| 1 | usenet.blueworldhosting.com | 11516 | 0 | 0.0 KB | 0 | 0 | 0 | 01:26:25 |
| 2 | 162.142.125.208 | 3 | 0 | 0.0 KB | 0 | 0 | 0 | 00:00:04 |
| 3 | 167.94.146.49 | 3 | 0 | 0.0 KB | 0 | 0 | 0 | 00:00:03 |
| 4 | 206.168.34.124 | 3 | 0 | 0.0 KB | 0 | 0 | 0 | 00:00:06 |
| 5 | 135.119.97.71 | 2 | 0 | 0.0 KB | 0 | 0 | 0 | 00:00:10 |
| 6 | 20.29.23.198 | 2 | 0 | 0.0 KB | 0 | 0 | 0 | 00:00:10 |
| 7 | 123.58.213.211 | 1 | 0 | 0.0 KB | 0 | 0 | 0 | 00:00:00 |
| 8 | 205.210.31.70 | 1 | 0 | 0.0 KB | 0 | 0 | 0 | 00:00:00 |
| 9 | 205.210.31.81 | 1 | 0 | 0.0 KB | 0 | 0 | 0 | 00:00:00 |
| TOTAL: 9 | 11532 | 0 | 0.0 KB | 0 | 0 | 0 | 01:27:02 | |
NNRP readership statistics (by domain):
| System | Conn | Arts | Size | Groups | Post | Rej | Elapsed | |
|---|---|---|---|---|---|---|---|---|
| 1 | *.blueworldhosting.com | 11516 | 0 | 0.0 KB | 0 | 0 | 0 | 01:26:25 |
| 2 | unresolved | 16 | 0 | 0.0 KB | 0 | 0 | 0 | 00:00:36 |
| TOTAL: 2 | 11532 | 0 | 0.0 KB | 0 | 0 | 0 | 01:27:02 | |
NNRP total resource statistics [Top 20]:
| System | User(ms) | System(ms) | Idle(ms) | Elapsed |
|---|---|---|---|---|
| usenet.blueworldhosting.com | 102.039 | 63.080 | 0.000 | 01:26:25 |
| 135.119.97.71 | 0.014 | 0.011 | 0.000 | 00:00:10 |
| 20.29.23.198 | 0.016 | 0.008 | 0.000 | 00:00:10 |
| 206.168.34.124 | 0.051 | 0.013 | 0.000 | 00:00:06 |
| 162.142.125.208 | 0.050 | 0.013 | 0.000 | 00:00:04 |
| 167.94.146.49 | 0.049 | 0.014 | 0.000 | 00:00:03 |
| 205.210.31.81 | 0.008 | 0.003 | 0.000 | 00:00:00 |
| 123.58.213.211 | 0.006 | 0.004 | 0.000 | 00:00:00 |
| 205.210.31.70 | 0.007 | 0.004 | 0.000 | 00:00:00 |
| TOTAL: 9 | 102.240 | 63.150 | 0.000 | 01:27:02 |
NNRP unrecognized commands (by host) [Top 20]:
| System | Conn |
|---|---|
| 135.119.97.71 | 1 |
| 162.142.125.208 | 1 |
| 167.94.146.49 | 1 |
| 20.29.23.198 | 1 |
| 206.168.34.124 | 1 |
| TOTAL: 5 | 5 |
NNRP unrecognized commands (by command) [Top 20]:
| Command | Count |
|---|---|
| EHLO www.censys.io | 3 |
| MGLNDD_109.238.130.155_119 | 2 |
| TOTAL: 2 | 5 |
NNRP client timeouts [Top 20]:
| System | Conn | Peer |
|---|---|---|
| 162.142.125.208 | 1 | 2 |
| 167.94.146.49 | 1 | 2 |
| 206.168.34.124 | 1 | 2 |
| TOTAL: 3 | 3 | 8 |