Unknown entries from news log file:
First 3 / 3 lines (100.0%)
Log entries by program:
| Program name | Lines | %Lines | Size | %Size |
|---|---|---|---|---|
| inn | 271424 | 86.5% | 38.9 MB | 88.1% |
| innd | 39619 | 12.6% | 5.0 MB | 11.3% |
| innfeed | 2516 | 0.8% | 281.9 KB | 0.6% |
| nnrpd | 198 | 0.1% | 21.0 KB | 0.0% |
| controlchan | 1 | 0.0% | 0.1 KB | 0.0% |
| TOTAL: 5 | 313758 | 100.0% | 44.1 MB | 100.0% |
History cache:
| Reason | Count | %Count |
|---|---|---|
| Negative hits | 271682 | 49.8% |
| Do not exist | 271271 | 49.7% |
| Positive hits | 1746 | 0.3% |
| Cache misses | 1166 | 0.2% |
| TOTAL: 4 | 545865 | 100.0% |
INND timer:
| Code region | Time | Pct | Invoked | Min(ms) | Avg(ms) | Max(ms) |
|---|---|---|---|---|---|---|
| article cancel | 00:00:00.133 | 0.0% | 65 | 0.000 | 2.046 | 46.500 |
| article cleanup | 00:00:01.169 | 0.0% | 271390 | 0.000 | 0.004 | 0.138 |
| article logging | 00:00:04.358 | 0.0% | 271444 | 0.000 | 0.016 | 0.097 |
| article parse | 00:00:02.438 | 0.0% | 799843 | 0.000 | 0.003 | 0.011 |
| article write | 00:02:11.774 | 0.2% | 247172 | 0.000 | 0.533 | 85.714 |
| artlog/artparse | 00:00:00.000 | 0.0% | 2 | 0.000 | 0.000 | 0.000 |
| data move | 00:00:00.711 | 0.0% | 816575 | 0.000 | 0.001 | 0.273 |
| hisgrep/artcncl | 00:00:00.003 | 0.0% | 65 | 0.000 | 0.046 | 0.056 |
| hishave/artparse | 00:00:00.000 | 0.0% | 0 | 0.000 | 0.000 | 0.000 |
| history grep | 00:00:00.000 | 0.0% | 0 | 0.000 | 0.000 | 0.000 |
| history lookup | 00:22:35.814 | 1.6% | 546670 | 0.000 | 2.480 | 22.077 |
| history sync | 00:00:00.012 | 0.0% | 307 | 0.000 | 0.039 | 2.000 |
| history write | 00:06:36.112 | 0.5% | 271389 | 0.000 | 1.460 | 23.387 |
| hiswrite/artparse | 00:00:00.000 | 0.0% | 0 | 0.000 | 0.000 | 0.000 |
| idle | 23:20:57.813 | 97.3% | 813737 | 82.942 | 103.299 | 20261.667 |
| nntp read | 00:00:07.513 | 0.0% | 812225 | 0.000 | 0.009 | 0.294 |
| overview write | 00:00:29.733 | 0.0% | 247172 | 0.000 | 0.120 | 27.500 |
| perl filter | 00:06:01.353 | 0.4% | 271387 | 0.333 | 1.332 | 39.000 |
| python filter | 00:00:15.024 | 0.0% | 533473 | 0.000 | 0.028 | 2.924 |
| site send | 00:00:02.025 | 0.0% | 247164 | 0.000 | 0.008 | 0.167 |
| TOTAL: 24:00:07.965 | 23:59:25.985 | 100.0% | - | - | - | - |
INNfeed timer:
| Code region | Time | Pct | Invoked | Min(ms) | Avg(ms) | Max(ms) |
|---|---|---|---|---|---|---|
| article new | 00:00:00.423 | 0.0% | 247181 | 0.000 | 0.002 | 0.053 |
| article prepare | 00:00:00.100 | 0.0% | 977456 | 0.000 | 0.000 | 0.083 |
| article read | 00:00:21.735 | 0.0% | 241700 | 0.000 | 0.090 | 9.832 |
| backlog stats | 00:00:00.388 | 0.0% | 1233655 | 0.000 | 0.000 | 0.040 |
| callbacks | 00:00:00.000 | 0.0% | 0 | 0.000 | 0.000 | 0.000 |
| data read | 00:00:05.398 | 0.0% | 738081 | 0.000 | 0.007 | 0.065 |
| data write | 00:00:08.063 | 0.0% | 492898 | 0.000 | 0.016 | 0.050 |
| idle | 23:58:21.726 | 99.9% | 1233655 | 41.220 | 69.956 | 11108.000 |
| status file | 00:00:00.235 | 0.0% | 246 | 0.000 | 0.955 | 16.667 |
| TOTAL: 23:59:11.736 | 23:58:58.068 | 100.0% | - | - | - | - |
nnrpd timer:
| Code region | Time | Pct | Invoked | Min(ms) | Avg(ms) | Max(ms) |
|---|---|---|---|---|---|---|
| idle | 00:17:11.610 | 97.5% | 249 | 79.000 | 4143.012 | 471700.500 |
| newnews | 00:00:00.000 | 0.0% | 0 | 0.000 | 0.000 | 0.000 |
| nntpwrite | 00:00:00.030 | 0.0% | 1045 | 0.000 | 0.029 | 0.035 |
| readart | 00:00:00.379 | 0.0% | 204 | 1.820 | 1.858 | 3.750 |
| TOTAL: 00:17:38.251 | 00:17:12.019 | 97.5% | - | - | - | - |
Control commands to INND:
| Command | Number |
|---|---|
| flush | 2 |
| flushlogs | 2 |
| go | 2 |
| logmode | 2 |
| lowmark | 1 |
| mode | 160 |
| name | 2 |
| pause | 2 |
| paused | 2 |
| reload | 2 |
| reserve | 2 |
| TOTAL: 11 | 179 |
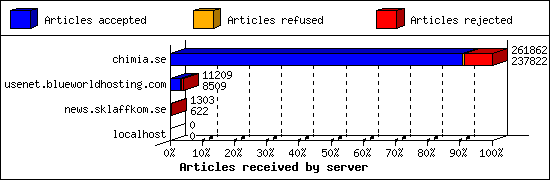
Incoming Feeds (INN):
| Server | Connects | Offered | Taken | Refused | Reject | %Accpt | Elapsed | |
|---|---|---|---|---|---|---|---|---|
| 1 | chimia.se | 2 | 261862 | 237822 | 1862 | 22178 | 90% | 23:49:12 |
| 2 | usenet.blueworldhosting.com | 1388 | 11209 | 8509 | 746 | 1954 | 75% | 23:42:37 |
| 3 | news.sklaffkom.se | 5 | 1303 | 622 | 679 | 2 | 47% | 21:02:22 |
| 4 | localhost | 25 | 0 | 0 | 0 | 0 | 0% | 00:00:00 |
| TOTAL: 4 | 1420 | 274374 | 246953 | 3287 | 24134 | 90% | 68:34:11 | |
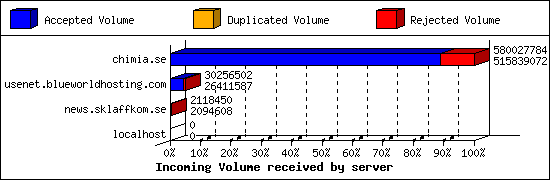
Incoming Volume (INN):
| Server | AcceptVol | DupVol | RejVol | TotalVol | %Acc | Vol/Art | |
|---|---|---|---|---|---|---|---|
| 1 | chimia.se | 491.9 MB | 18.1 KB | 61.2 MB | 553.2 MB | 88% | 2.2 KB |
| 2 | usenet.blueworldhosting.com | 25.2 MB | 0.0 KB | 3.7 MB | 28.9 MB | 87% | 2.8 KB |
| 3 | news.sklaffkom.se | 2.0 MB | 16.4 KB | 6.9 KB | 2.0 MB | 98% | 3.3 KB |
| 4 | localhost | 0.0 KB | 0.0 KB | 0.0 KB | 0.0 KB | 0% | 0 |
| TOTAL: 4 | 519.1 MB | 34.5 KB | 64.9 MB | 584.0 MB | 88% | 2.2 KB | |
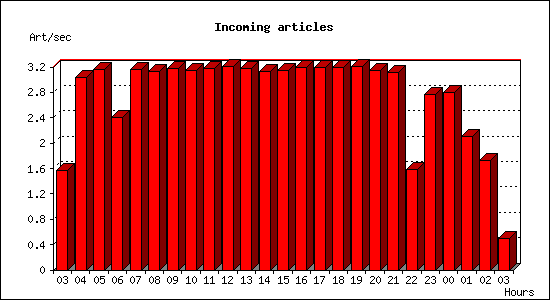
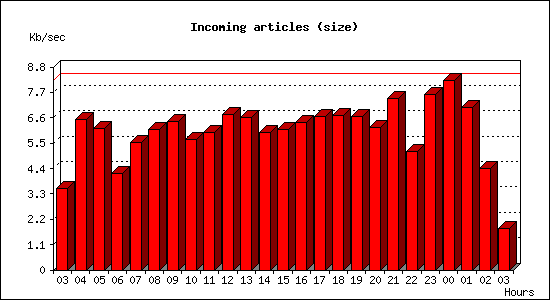
Incoming articles:
| Date | Articles | %Arts | Art/sec | Size | %Size | KB/sec |
|---|---|---|---|---|---|---|
| Oct 29 03:00:01 - 03:59:59 | 5627 | 2.3% | 1.56 | 12.4 MB | 2.4% | 3.54 |
| Oct 29 04:00:00 - 04:59:59 | 10896 | 4.4% | 3.03 | 22.9 MB | 4.4% | 6.50 |
| Oct 29 05:00:00 - 05:59:59 | 11378 | 4.6% | 3.16 | 21.5 MB | 4.1% | 6.11 |
| Oct 29 06:00:00 - 06:59:59 | 8650 | 3.5% | 2.40 | 14.7 MB | 2.8% | 4.18 |
| Oct 29 07:00:00 - 07:59:59 | 11382 | 4.6% | 3.16 | 19.4 MB | 3.7% | 5.51 |
| Oct 29 08:00:00 - 08:59:59 | 11293 | 4.6% | 3.14 | 21.5 MB | 4.1% | 6.10 |
| Oct 29 09:00:00 - 09:59:59 | 11455 | 4.6% | 3.18 | 22.6 MB | 4.3% | 6.43 |
| Oct 29 10:00:00 - 10:59:59 | 11321 | 4.6% | 3.14 | 19.9 MB | 3.8% | 5.65 |
| Oct 29 11:00:00 - 11:59:59 | 11450 | 4.6% | 3.18 | 20.9 MB | 4.0% | 5.95 |
| Oct 29 12:00:00 - 12:59:59 | 11539 | 4.7% | 3.21 | 23.7 MB | 4.6% | 6.73 |
| Oct 29 13:00:00 - 13:59:59 | 11445 | 4.6% | 3.18 | 23.2 MB | 4.5% | 6.59 |
| Oct 29 14:00:00 - 14:59:59 | 11247 | 4.6% | 3.12 | 21.0 MB | 4.0% | 5.96 |
| Oct 29 15:00:00 - 15:59:59 | 11302 | 4.6% | 3.14 | 21.4 MB | 4.1% | 6.09 |
| Oct 29 16:00:00 - 16:59:59 | 11467 | 4.6% | 3.19 | 22.5 MB | 4.3% | 6.39 |
| Oct 29 17:00:00 - 17:59:59 | 11505 | 4.7% | 3.20 | 23.3 MB | 4.5% | 6.64 |
| Oct 29 18:00:00 - 18:59:59 | 11504 | 4.7% | 3.20 | 23.5 MB | 4.5% | 6.69 |
| Oct 29 19:00:00 - 19:59:59 | 11534 | 4.7% | 3.20 | 23.4 MB | 4.5% | 6.65 |
| Oct 29 20:00:00 - 20:59:59 | 11348 | 4.6% | 3.15 | 21.8 MB | 4.2% | 6.19 |
| Oct 29 21:00:00 - 21:59:59 | 11231 | 4.5% | 3.12 | 26.1 MB | 5.0% | 7.43 |
| Oct 29 22:00:00 - 22:59:59 | 5709 | 2.3% | 1.59 | 18.1 MB | 3.5% | 5.14 |
| Oct 29 23:00:00 - 23:59:59 | 9987 | 4.0% | 2.77 | 26.8 MB | 5.2% | 7.63 |
| Oct 30 00:00:00 - 00:59:59 | 10045 | 4.1% | 2.79 | 28.9 MB | 5.6% | 8.22 |
| Oct 30 01:00:00 - 01:59:59 | 7574 | 3.1% | 2.10 | 24.8 MB | 4.8% | 7.05 |
| Oct 30 02:00:00 - 02:59:59 | 6235 | 2.5% | 1.73 | 15.4 MB | 3.0% | 4.38 |
| Oct 30 03:00:00 - 03:00:02 | 1 | 0.0% | 0.50 | 3.6 KB | 0.0% | 1.81 |
| TOTAL: 24:00:01 | 247125 | 100.0% | 2.86 | 519.5 MB | 100.0% | 6.16 |
Sites sending bad articles:
| Server | Total | Group | Dist | Duplic | Unapp | TooOld | Site | Line | Other | |
|---|---|---|---|---|---|---|---|---|---|---|
| 1 | chimia.se | 22295 | 0 | 0 | 2 | 2 | 0 | 0 | 0 | 22291 |
| 2 | usenet.blueworldhosting.com | 2001 | 400 | 0 | 0 | 0 | 0 | 0 | 0 | 1601 |
| 3 | news.sklaffkom.se | 3 | 1 | 0 | 1 | 0 | 0 | 0 | 0 | 1 |
| TOTAL: 3 | 24299 | 401 | 0 | 3 | 2 | 0 | 0 | 0 | 23893 | |
Unwanted newsgroups [Top 20]:
| Newsgroup | Count |
|---|---|
| hispagatos.hacking.ransomware | 33 |
| hispagatos.mastodon.tag.hacking | 17 |
| de.alt.fan.aldi | 16 |
| nz.general | 16 |
| de.rec.heimwerken | 14 |
| fr.comp.os.mac-os.x | 13 |
| de.etc.finanz.banken+broker | 12 |
| relcom.wheels | 11 |
| de.rec.tv.technik | 10 |
| de.sci.ing.elektrotechnik | 10 |
| sfnet.huuhaa | 9 |
| de.admin.infos | 8 |
| de.soc.recht.strafrecht | 8 |
| nl.muziek | 8 |
| uk.telecom.voip | 8 |
| fr.soc.economie | 7 |
| fr.rec.moto | 6 |
| it.sport.motociclismo | 6 |
| at.test | 5 |
| aus.computers | 5 |
| TOTAL: 117 | 401 |
Supposedly-moderated groups with unmoderated postings [Top 20]:
| Groups | Count |
|---|---|
| comp.ai | 2 |
| TOTAL: 1 | 2 |
INND Perl filter [Top 20]:
| Reason | Count |
|---|---|
| EMP (phn path) | 7581 |
| EMP (phn nph) | 4438 |
| EMP (phr path) | 3715 |
| Too many newsgroups (meow) | 2852 |
| EMP (phl) | 2339 |
| EMP (md5) | 1221 |
| EMP (phr nph) | 1182 |
| Too many newsgroups (low_xpost) | 171 |
| Too many newsgroups | 93 |
| HTML Multipart | 70 |
| EMP (fsl) | 44 |
| Too many test groups in crosspost | 33 |
| Subject Rejected | 22 |
| MI5 Filter | 20 |
| Scoring filter | 19 |
| User-issued cancel | 12 |
| HTML Image Tags | 6 |
| U2 violation - invalid distribution | 5 |
| PFM bot misc | 4 |
| HTML post | 3 |
| TOTAL: 25 | 23837 |
Miscellaneous innd statistics [Top 10]:
| Event | Server | Number |
|---|---|---|
| Bad Message-ID's offered | ||
| chimia.se | 9 | |
| TOTAL: 1 | 9 | |
| Including strange strings | ||
| usenet.blueworldhosting.com | 47 | |
| chimia.se | 6 | |
| news.sklaffkom.se | 1 | |
| TOTAL: 3 | 54 | |
| No colon-space in header field | ||
| usenet.blueworldhosting.com | 2 | |
| TOTAL: 1 | 2 | |
| TOTAL: 3 | 65 | |
Outgoing Feeds (innfeed) by Articles:
| Server | Offered | Taken | Refused | Reject | Miss | Spool | %Took | Elapsed | |
|---|---|---|---|---|---|---|---|---|---|
| 1 | sklaffkom.se | 247035 | 3384 | 4730 | 238282 | 0 | 100 | 1% | 23:59:58 |
| 2 | usenet.blueworldhosting.com | 3253 | 4 | 493 | 2729 | 0 | 0 | 0% | 23:02:59 |
| 3 | sklaff.dev | 0 | 0 | 0 | 0 | 0 | 247102 | 0% | 23:57:43 |
| 4 | thebunker.nu | 0 | 0 | 0 | 0 | 0 | 247102 | 0% | 23:59:59 |
| TOTAL: 4 | 250288 | 3388 | 5223 | 241011 | 0 | 494304 | 1% | 95:00:39 | |

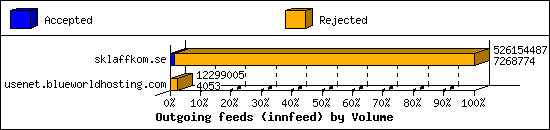
Outgoing Feeds (innfeed) by Volume:
| Server | AcceptVol | RejectVol | TotalVol | Volume/sec | Vol/Art | Elapsed | |
|---|---|---|---|---|---|---|---|
| 1 | sklaffkom.se | 6.9 MB | 494.8 MB | 501.8 MB | 5.9 KB/s | 2.1 KB | 23:59:58 |
| 2 | usenet.blueworldhosting.com | 4.0 KB | 11.7 MB | 11.7 MB | 0.1 KB/s | 4.4 KB | 23:02:59 |
| 3 | sklaff.dev | 0.0 KB | 0.0 KB | 0.0 KB | 0.0 KB/s | 0 | 23:57:43 |
| 4 | thebunker.nu | 0.0 KB | 0.0 KB | 0.0 KB | 0.0 KB/s | 0 | 23:59:59 |
| TOTAL: 4 | 6.9 MB | 506.6 MB | 513.5 MB | 1.5 KB/s | 2.2 KB | 95:00:39 | |
NNRP readership statistics:
| System | Conn | Arts | Size | Groups | Post | Rej | Elapsed | |
|---|---|---|---|---|---|---|---|---|
| 1 | 66.61.98.95 | 4 | 204 | 11.6 MB | 2 | 0 | 0 | 00:00:53 |
| TOTAL: 1 | 4 | 204 | 11.6 MB | 2 | 0 | 0 | 00:17:38 | |
NNRP readership statistics (by domain):
| System | Conn | Arts | Size | Groups | Post | Rej | Elapsed | |
|---|---|---|---|---|---|---|---|---|
| 1 | unresolved | 9 | 204 | 11.6 MB | 2 | 0 | 0 | 00:16:56 |
| 2 | *.monitoring.internet-measurement.com | 6 | 0 | 0.0 KB | 0 | 0 | 0 | 00:00:06 |
| 3 | *.210.203.35.bc.googleusercontent.com | 5 | 0 | 0.0 KB | 0 | 0 | 0 | 00:00:01 |
| 4 | *.stretchoid.com | 4 | 0 | 0.0 KB | 0 | 0 | 0 | 00:00:20 |
| 5 | *.ch1.censys-scanner.com | 3 | 0 | 0.0 KB | 0 | 0 | 0 | 00:00:12 |
| 6 | *.149.216.162.bc.googleusercontent.com | 1 | 0 | 0.0 KB | 0 | 0 | 0 | 00:00:00 |
| 7 | *.ip.linodeusercontent.com | 1 | 0 | 0.0 KB | 0 | 0 | 0 | 00:00:00 |
| TOTAL: 7 | 29 | 204 | 11.6 MB | 2 | 0 | 0 | 00:17:38 | |
NNRP total resource statistics [Top 20]:
| System | User(ms) | System(ms) | Idle(ms) | Elapsed |
|---|---|---|---|---|
| 60.190.226.189 | 0.006 | 0.007 | 0.000 | 00:15:43 |
| 66.61.98.95 | 0.057 | 0.063 | 0.000 | 00:00:53 |
| 147.185.133.185 | 0.081 | 0.009 | 0.000 | 00:00:15 |
| scanner-201.ch1.censys-scanner.com | 0.057 | 0.015 | 0.000 | 00:00:12 |
| azpdwsxhx7x0.stretchoid.com | 0.013 | 0.015 | 0.000 | 00:00:10 |
| azpdws42bp6k.stretchoid.com | 0.016 | 0.010 | 0.000 | 00:00:10 |
| unshakable.monitoring.internet-measurement.com | 0.043 | 0.002 | 0.000 | 00:00:03 |
| optimistic.monitoring.internet-measurement.com | 0.042 | 0.006 | 0.000 | 00:00:03 |
| 198.235.24.175 | 0.006 | 0.007 | 0.000 | 00:00:01 |
| 3.210.203.35.bc.googleusercontent.com | 0.196 | 0.021 | 0.000 | 00:00:01 |
| 205.210.31.181 | 0.007 | 0.007 | 0.000 | 00:00:01 |
| 45-33-14-197.ip.linodeusercontent.com | 0.006 | 0.006 | 0.000 | 00:00:00 |
| 40.149.216.162.bc.googleusercontent.com | 0.040 | 0.006 | 0.000 | 00:00:00 |
| 15.210.203.35.bc.googleusercontent.com | 0.042 | 0.005 | 0.000 | 00:00:00 |
| jovial.monitoring.internet-measurement.com | 0.064 | 0.005 | 0.000 | 00:00:00 |
| enhanced.monitoring.internet-measurement.com | 0.041 | 0.005 | 0.000 | 00:00:00 |
| collaborative.monitoring.internet-measurement.com | 0.041 | 0.004 | 0.000 | 00:00:00 |
| TOTAL: 17 | 0.758 | 0.193 | 0.000 | 00:17:38 |
Curious NNRP server explorers [Top 20]:
| System | Conn |
|---|---|
| 3.210.203.35.bc.googleusercontent.com | 4 |
| scanner-201.ch1.censys-scanner.com | 3 |
| 147.185.133.185 | 2 |
| azpdws42bp6k.stretchoid.com | 2 |
| azpdwsxhx7x0.stretchoid.com | 2 |
| 15.210.203.35.bc.googleusercontent.com | 1 |
| 198.235.24.175 | 1 |
| 205.210.31.181 | 1 |
| 40.149.216.162.bc.googleusercontent.com | 1 |
| 45-33-14-197.ip.linodeusercontent.com | 1 |
| 60.190.226.189 | 1 |
| collaborative.monitoring.internet-measurement.com | 1 |
| enhanced.monitoring.internet-measurement.com | 1 |
| jovial.monitoring.internet-measurement.com | 1 |
| modest.monitoring.internet-measurement.com | 1 |
| optimistic.monitoring.internet-measurement.com | 1 |
| unshakable.monitoring.internet-measurement.com | 1 |
| TOTAL: 17 | 25 |
NNRP gethostbyaddr failures [Top 20]:
| System | Conn |
|---|---|
| ? (can't getpeername) | 8 |
| TOTAL: 1 | 8 |
NNRP unrecognized commands (by host) [Top 20]:
| System | Conn |
|---|---|
| 3.210.203.35.bc.googleusercontent.com | 8 |
| 147.185.133.185 | 4 |
| 15.210.203.35.bc.googleusercontent.com | 4 |
| 40.149.216.162.bc.googleusercontent.com | 4 |
| 60.190.226.189 | 1 |
| azpdws42bp6k.stretchoid.com | 1 |
| azpdwsxhx7x0.stretchoid.com | 1 |
| scanner-201.ch1.censys-scanner.com | 1 |
| TOTAL: 8 | 24 |
NNRP unrecognized commands (by command) [Top 20]:
| Command | Count |
|---|---|
| GET / HTTP/1.1 | 5 |
| Host: 109.238.130.155:563 | 5 |
| Accept: */* | 3 |
| User-Agent: curl/7.68.0 | 3 |
| Accept-Encoding: gzip | 2 |
| MGLNDD_109.238.130.155_119 | 2 |
| User-Agent: Hello from Palo Alto Network... | 2 |
| EHLO www.censys.io | 1 |
| GET / HTTP/1.0 | 1 |
| TOTAL: 9 | 24 |
NNRP client timeouts [Top 20]:
| System | Conn | Peer |
|---|---|---|
| 3.210.203.35.bc.googleusercontent.com | 2 | 4 |
| 60.190.226.189 | 2 | 0 |
| 147.185.133.185 | 1 | 2 |
| 15.210.203.35.bc.googleusercontent.com | 1 | 1 |
| 40.149.216.162.bc.googleusercontent.com | 1 | 1 |
| scanner-201.ch1.censys-scanner.com | 1 | 2 |
| TOTAL: 6 | 8 | 14 |
Newsgroup request counts (by hierarchy):
| Hierarchy | Count | Pct | |
|---|---|---|---|
| 1 | alt | 204 | 100.0% |
| TOTAL: 1 | 204 | 100.0% | |
Newsgroup request counts (by newsgroup) [Top 100]:
| Newsgroup | Count | |
|---|---|---|
| 1 | alt.answers | 200 |
| 2 | alt.atari | 4 |
| TOTAL: 2 | 204 | |