
Unknown entries from news log file:
First 1 / 1 lines (100.0%)
Log entries by program:
| Program name | Lines | %Lines | Size | %Size |
|---|---|---|---|---|
| inn | 253764 | 65.1% | 34.7 MB | 69.9% |
| innd | 133448 | 34.2% | 14.6 MB | 29.5% |
| innfeed | 2427 | 0.6% | 250.1 KB | 0.5% |
| nnrpd | 446 | 0.1% | 44.4 KB | 0.1% |
| controlchan | 1 | 0.0% | 0.1 KB | 0.0% |
| TOTAL: 5 | 390086 | 100.0% | 49.6 MB | 100.0% |
History cache:
| Reason | Count | %Count |
|---|---|---|
| Do not exist | 253571 | 50.0% |
| Negative hits | 253363 | 49.9% |
| Cache misses | 297 | 0.1% |
| Positive hits | 172 | 0.0% |
| TOTAL: 4 | 507403 | 100.0% |
INND timer:
| Code region | Time | Pct | Invoked | Min(ms) | Avg(ms) | Max(ms) |
|---|---|---|---|---|---|---|
| article cancel | 00:00:00.229 | 0.0% | 8 | 0.000 | 28.625 | 75.000 |
| article cleanup | 00:00:01.056 | 0.0% | 253552 | 0.000 | 0.004 | 0.140 |
| article logging | 00:00:03.629 | 0.0% | 253657 | 0.000 | 0.014 | 0.074 |
| article parse | 00:00:02.329 | 0.0% | 766558 | 0.000 | 0.003 | 0.015 |
| article write | 00:04:54.601 | 0.3% | 127666 | 0.000 | 2.308 | 61.406 |
| artlog/artparse | 00:00:00.000 | 0.0% | 0 | 0.000 | 0.000 | 0.000 |
| artlog/artwrite | 00:00:00.000 | 0.0% | 0 | 0.000 | 0.000 | 0.000 |
| data move | 00:00:00.267 | 0.0% | 779058 | 0.000 | 0.000 | 0.006 |
| hisgrep/artcncl | 00:00:00.003 | 0.0% | 8 | 0.000 | 0.375 | 2.000 |
| hishave/artparse | 00:00:00.000 | 0.0% | 0 | 0.000 | 0.000 | 0.000 |
| hissync/artwrite | 00:00:00.000 | 0.0% | 0 | 0.000 | 0.000 | 0.000 |
| history grep | 00:00:00.000 | 0.0% | 0 | 0.000 | 0.000 | 0.000 |
| history lookup | 00:23:08.973 | 1.6% | 507572 | 0.000 | 2.737 | 10.474 |
| history sync | 00:00:00.015 | 0.0% | 316 | 0.000 | 0.047 | 7.000 |
| history write | 00:03:41.146 | 0.3% | 253551 | 0.000 | 0.872 | 6.441 |
| hiswrite/artparse | 00:00:00.000 | 0.0% | 0 | 0.000 | 0.000 | 0.000 |
| idle | 23:20:48.001 | 97.3% | 767373 | 22.355 | 109.527 | 60037.000 |
| nntp read | 00:00:05.934 | 0.0% | 767083 | 0.000 | 0.008 | 0.128 |
| overview write | 00:00:12.151 | 0.0% | 127666 | 0.000 | 0.095 | 6.961 |
| perl filter | 00:05:34.685 | 0.4% | 253551 | 0.380 | 1.320 | 8.465 |
| python filter | 00:00:14.257 | 0.0% | 507571 | 0.000 | 0.028 | 0.357 |
| site send | 00:00:00.977 | 0.0% | 127666 | 0.000 | 0.008 | 0.104 |
| TOTAL: 23:59:25.632 | 23:58:48.253 | 100.0% | - | - | - | - |
INNfeed timer:
| Code region | Time | Pct | Invoked | Min(ms) | Avg(ms) | Max(ms) |
|---|---|---|---|---|---|---|
| article new | 00:00:00.203 | 0.0% | 127679 | 0.000 | 0.002 | 0.029 |
| article prepare | 00:00:00.000 | 0.0% | 0 | 0.000 | 0.000 | 0.000 |
| article read | 00:00:00.000 | 0.0% | 0 | 0.000 | 0.000 | 0.000 |
| backlog stats | 00:00:00.056 | 0.0% | 132396 | 0.000 | 0.000 | 0.048 |
| callbacks | 00:00:00.000 | 0.0% | 0 | 0.000 | 0.000 | 0.000 |
| data read | 00:00:01.360 | 0.0% | 127706 | 0.000 | 0.011 | 0.105 |
| data write | 00:00:00.000 | 0.0% | 119 | 0.000 | 0.000 | 0.000 |
| idle | 23:59:29.321 | 100.0% | 132396 | 127.587 | 652.356 | 30062.500 |
| status file | 00:00:00.250 | 0.0% | 222 | 0.000 | 1.126 | 39.000 |
| TOTAL: 23:59:33.546 | 23:59:31.190 | 100.0% | - | - | - | - |
nnrpd timer:
| Code region | Time | Pct | Invoked | Min(ms) | Avg(ms) | Max(ms) |
|---|---|---|---|---|---|---|
| idle | 00:01:56.738 | 59.5% | 567 | 26.857 | 205.887 | 10051.000 |
| newnews | 00:00:00.000 | 0.0% | 0 | 0.000 | 0.000 | 0.000 |
| nntpwrite | 00:00:00.452 | 0.2% | 1340 | 0.000 | 0.337 | 0.635 |
| readart | 00:00:00.263 | 0.1% | 12 | 6.750 | 21.917 | 29.500 |
| TOTAL: 00:03:16.149 | 00:01:57.453 | 59.9% | - | - | - | - |
Control commands to INND:
| Command | Number |
|---|---|
| flush | 2 |
| flushlogs | 2 |
| go | 2 |
| logmode | 2 |
| lowmark | 1 |
| mode | 144 |
| name | 2 |
| pause | 2 |
| paused | 2 |
| reload | 2 |
| reserve | 2 |
| TOTAL: 11 | 163 |
Incoming Feeds (INN):
| Server | Connects | Offered | Taken | Refused | Reject | %Accpt | Elapsed | |
|---|---|---|---|---|---|---|---|---|
| 1 | chimia.se | 1 | 254244 | 127809 | 468 | 125967 | 50% | 23:57:14 |
| 2 | localhost | 25 | 0 | 0 | 0 | 0 | 0% | 00:00:01 |
| 3 | news.thebunker.nu | 11 | 0 | 0 | 0 | 0 | 0% | 00:00:00 |
| TOTAL: 3 | 37 | 254244 | 127809 | 468 | 125967 | 50% | 23:57:15 | |
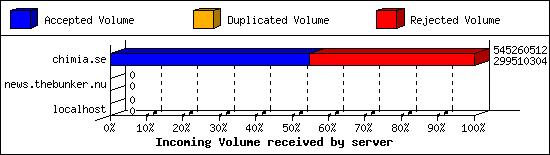
Incoming Volume (INN):
| Server | AcceptVol | DupVol | RejVol | TotalVol | %Acc | Vol/Art | |
|---|---|---|---|---|---|---|---|
| 1 | chimia.se | 285.6 MB | 4.3 KB | 234.4 MB | 520.0 MB | 54% | 2.1 KB |
| 2 | localhost | 0.0 KB | 0.0 KB | 0.0 KB | 0.0 KB | 0% | 0 |
| 3 | news.thebunker.nu | 0.0 KB | 0.0 KB | 0.0 KB | 0.0 KB | 0% | 0 |
| TOTAL: 3 | 285.6 MB | 4.3 KB | 234.4 MB | 520.0 MB | 54% | 2.1 KB | |
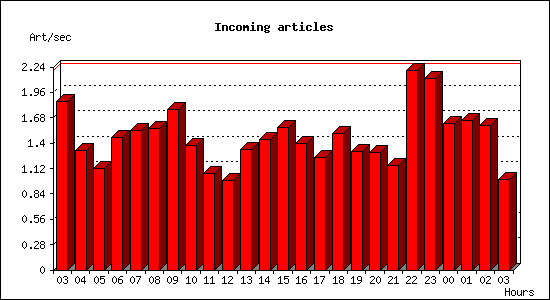
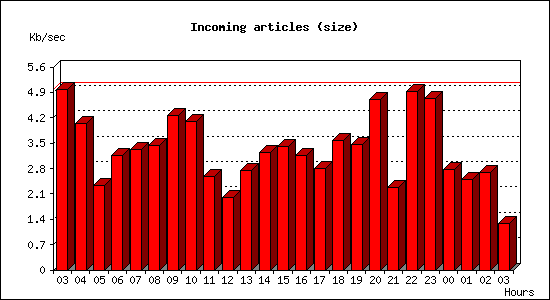
Incoming articles:
| Date | Articles | %Arts | Art/sec | Size | %Size | KB/sec |
|---|---|---|---|---|---|---|
| Dec 9 03:00:01 - 03:59:59 | 6687 | 5.2% | 1.86 | 17.5 MB | 6.1% | 4.97 |
| Dec 9 04:00:00 - 04:59:59 | 4750 | 3.7% | 1.32 | 14.2 MB | 5.0% | 4.04 |
| Dec 9 05:00:00 - 05:59:59 | 4014 | 3.1% | 1.11 | 8.2 MB | 2.9% | 2.32 |
| Dec 9 06:00:00 - 06:59:59 | 5250 | 4.1% | 1.46 | 11.1 MB | 3.9% | 3.16 |
| Dec 9 07:00:00 - 07:59:59 | 5524 | 4.3% | 1.53 | 11.7 MB | 4.1% | 3.34 |
| Dec 9 08:00:00 - 08:59:59 | 5623 | 4.4% | 1.56 | 12.1 MB | 4.2% | 3.45 |
| Dec 9 09:00:00 - 09:59:59 | 6389 | 5.0% | 1.77 | 15.0 MB | 5.3% | 4.27 |
| Dec 9 10:00:00 - 10:59:59 | 4959 | 3.9% | 1.38 | 14.4 MB | 5.0% | 4.09 |
| Dec 9 11:00:00 - 11:59:59 | 3853 | 3.0% | 1.07 | 9.1 MB | 3.2% | 2.58 |
| Dec 9 12:00:00 - 12:59:59 | 3539 | 2.8% | 0.98 | 7.0 MB | 2.4% | 1.99 |
| Dec 9 13:00:00 - 13:59:59 | 4785 | 3.7% | 1.33 | 9.6 MB | 3.4% | 2.74 |
| Dec 9 14:00:00 - 14:59:59 | 5188 | 4.1% | 1.44 | 11.4 MB | 4.0% | 3.24 |
| Dec 9 15:00:00 - 15:59:59 | 5642 | 4.4% | 1.57 | 12.0 MB | 4.2% | 3.42 |
| Dec 9 16:00:00 - 16:59:59 | 5028 | 3.9% | 1.40 | 11.1 MB | 3.9% | 3.15 |
| Dec 9 17:00:00 - 17:59:59 | 4483 | 3.5% | 1.25 | 9.9 MB | 3.5% | 2.81 |
| Dec 9 18:00:00 - 18:59:59 | 5415 | 4.2% | 1.50 | 12.6 MB | 4.4% | 3.57 |
| Dec 9 19:00:00 - 19:59:59 | 4716 | 3.7% | 1.31 | 12.2 MB | 4.3% | 3.46 |
| Dec 9 20:00:00 - 20:59:59 | 4654 | 3.6% | 1.29 | 16.5 MB | 5.8% | 4.69 |
| Dec 9 21:00:00 - 21:59:59 | 4170 | 3.3% | 1.16 | 8.0 MB | 2.8% | 2.28 |
| Dec 9 22:00:00 - 22:59:59 | 7942 | 6.2% | 2.21 | 17.3 MB | 6.1% | 4.92 |
| Dec 9 23:00:00 - 23:59:59 | 7590 | 5.9% | 2.11 | 16.6 MB | 5.8% | 4.73 |
| Dec 10 00:00:00 - 00:59:59 | 5835 | 4.6% | 1.62 | 9.7 MB | 3.4% | 2.76 |
| Dec 10 01:00:00 - 01:59:59 | 5954 | 4.7% | 1.65 | 8.8 MB | 3.1% | 2.51 |
| Dec 10 02:00:00 - 02:59:59 | 5723 | 4.5% | 1.59 | 9.4 MB | 3.3% | 2.69 |
| Dec 10 03:00:00 - 03:00:01 | 1 | 0.0% | 1.00 | 1.3 KB | 0.0% | 1.28 |
| TOTAL: 24:00:00 | 127714 | 100.0% | 1.48 | 285.4 MB | 100.0% | 3.38 |
Sites sending bad articles:
| Server | Total | Group | Dist | Duplic | Unapp | TooOld | Site | Line | Other | |
|---|---|---|---|---|---|---|---|---|---|---|
| 1 | chimia.se | 126050 | 0 | 0 | 1 | 1 | 0 | 0 | 0 | 126048 |
| TOTAL: 1 | 126050 | 0 | 0 | 1 | 1 | 0 | 0 | 0 | 126048 | |
Supposedly-moderated groups with unmoderated postings [Top 20]:
| Groups | Count |
|---|---|
| news.newusers.questions | 1 |
| TOTAL: 1 | 1 |
INND Perl filter [Top 20]:
| Reason | Count |
|---|---|
| EMP (phn nph) | 60306 |
| EMP (phn path) | 41983 |
| EMP (phl) | 20051 |
| EMP (md5) | 2303 |
| HTML Multipart | 1064 |
| Subject Rejected | 76 |
| Too many newsgroups (meow) | 67 |
| Too many newsgroups (low_xpost) | 32 |
| MI5 Filter | 22 |
| EMP (fsl) | 20 |
| Scoring filter | 9 |
| Binary: misplaced binary | 3 |
| HTML post | 2 |
| Binary Image: misplaced gif | 1 |
| Malformed article | 1 |
| U2 violation - invalid distribution | 1 |
| TOTAL: 16 | 125941 |
Miscellaneous innd statistics [Top 10]:
| Event | Server | Number |
|---|---|---|
| Bad Message-ID's offered | ||
| chimia.se | 13 | |
| TOTAL: 1 | 13 | |
| Including strange strings | ||
| chimia.se | 107 | |
| TOTAL: 1 | 107 | |
| TOTAL: 2 | 120 | |
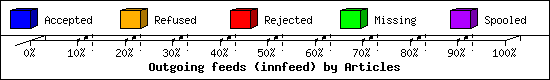
Outgoing Feeds (innfeed) by Articles:
| Server | Offered | Taken | Refused | Reject | Miss | Spool | %Took | Elapsed | |
|---|---|---|---|---|---|---|---|---|---|
| 1 | sklaff.dev | 0 | 0 | 0 | 0 | 0 | 127713 | 0% | 23:57:45 |
| 2 | sklaffkom.se | 0 | 0 | 0 | 0 | 0 | 127713 | 0% | 23:59:58 |
| 3 | thebunker.nu | 0 | 0 | 0 | 0 | 0 | 127713 | 0% | 23:59:58 |
| 4 | usenet.blueworldhosting.com | 0 | 0 | 0 | 0 | 0 | 97063 | 0% | 23:59:57 |
| TOTAL: 4 | 0 | 0 | 0 | 0 | 0 | 480202 | 0% | 95:57:38 | |
Outgoing Feeds (innfeed) by Volume:
| Server | AcceptVol | RejectVol | TotalVol | Volume/sec | Vol/Art | Elapsed | |
|---|---|---|---|---|---|---|---|
| 1 | sklaff.dev | 0.0 KB | 0.0 KB | 0.0 KB | 0.0 KB/s | 0 | 23:57:45 |
| 2 | sklaffkom.se | 0.0 KB | 0.0 KB | 0.0 KB | 0.0 KB/s | 0 | 23:59:58 |
| 3 | thebunker.nu | 0.0 KB | 0.0 KB | 0.0 KB | 0.0 KB/s | 0 | 23:59:58 |
| 4 | usenet.blueworldhosting.com | 0.0 KB | 0.0 KB | 0.0 KB | 0.0 KB/s | 0 | 23:59:57 |
| TOTAL: 4 | 0.0 KB | 0.0 KB | 0.0 KB | 0.0 KB/s | 0 | 95:57:38 | |
NNRP readership statistics:
| System | Conn | Arts | Size | Groups | Post | Rej | Elapsed | |
|---|---|---|---|---|---|---|---|---|
| 1 | 66.61.98.95 | 20 | 12 | 27.4 KB | 2 | 0 | 0 | 00:01:47 |
| TOTAL: 1 | 20 | 12 | 27.4 KB | 2 | 0 | 0 | 00:03:16 | |
NNRP readership statistics (by domain):
| System | Conn | Arts | Size | Groups | Post | Rej | Elapsed | |
|---|---|---|---|---|---|---|---|---|
| 1 | unresolved | 25 | 12 | 27.4 KB | 2 | 0 | 0 | 00:01:52 |
| 2 | *.tbcn.telia.com | 11 | 0 | 0.0 KB | 0 | 0 | 0 | 00:00:05 |
| 3 | *.150.216.162.bc.googleusercontent.com | 6 | 0 | 0.0 KB | 0 | 0 | 0 | 00:00:45 |
| 4 | *.scanner.modat.io | 3 | 0 | 0.0 KB | 0 | 0 | 0 | 00:00:04 |
| 5 | *.149.216.162.bc.googleusercontent.com | 2 | 0 | 0.0 KB | 0 | 0 | 0 | 00:00:16 |
| 6 | *.stretchoid.com | 2 | 0 | 0.0 KB | 0 | 0 | 0 | 00:00:10 |
| 7 | *.210.203.35.bc.googleusercontent.com | 1 | 0 | 0.0 KB | 0 | 0 | 0 | 00:00:00 |
| 8 | *.211.203.35.bc.googleusercontent.com | 1 | 0 | 0.0 KB | 0 | 0 | 0 | 00:00:00 |
| 9 | *.ch1.censys-scanner.com | 1 | 0 | 0.0 KB | 0 | 0 | 0 | 00:00:00 |
| 10 | *.shodan.io | 1 | 0 | 0.0 KB | 0 | 0 | 0 | 00:00:00 |
| TOTAL: 10 | 53 | 12 | 27.4 KB | 2 | 0 | 0 | 00:03:16 | |
NNRP auth users [Top 20]:
| User | Conn |
|---|---|
| peterlondon | 11 |
| TOTAL: 1 | 11 |
NNRP total resource statistics [Top 20]:
| System | User(ms) | System(ms) | Idle(ms) | Elapsed |
|---|---|---|---|---|
| 66.61.98.95 | 0.186 | 0.138 | 0.000 | 00:01:47 |
| 65.150.216.162.bc.googleusercontent.com | 0.242 | 0.031 | 0.000 | 00:00:45 |
| 16.149.216.162.bc.googleusercontent.com | 0.078 | 0.013 | 0.000 | 00:00:16 |
| azpdss2funsd.stretchoid.com | 0.012 | 0.011 | 0.000 | 00:00:10 |
| 81-229-79-101-no600.tbcn.telia.com | 0.083 | 0.075 | 0.225 | 00:00:05 |
| o304.scanner.modat.io | 0.114 | 0.017 | 0.000 | 00:00:04 |
| 167.94.138.203 | 0.056 | 0.015 | 0.000 | 00:00:03 |
| 205.210.31.200 | 0.007 | 0.006 | 0.000 | 00:00:01 |
| census9.shodan.io | 0.006 | 0.006 | 0.000 | 00:00:00 |
| scanner-202.ch1.censys-scanner.com | 0.041 | 0.005 | 0.000 | 00:00:00 |
| 116.211.203.35.bc.googleusercontent.com | 0.046 | 0.006 | 0.000 | 00:00:00 |
| 189.210.203.35.bc.googleusercontent.com | 0.040 | 0.007 | 0.000 | 00:00:00 |
| 51.159.234.118 | 0.035 | 0.010 | 0.000 | 00:00:00 |
| TOTAL: 13 | 0.946 | 0.340 | 0.225 | 00:03:16 |
Curious NNRP server explorers [Top 20]:
| System | Conn |
|---|---|
| 81-229-79-101-no600.tbcn.telia.com | 11 |
| 65.150.216.162.bc.googleusercontent.com | 6 |
| 167.94.138.203 | 3 |
| o304.scanner.modat.io | 3 |
| 16.149.216.162.bc.googleusercontent.com | 2 |
| azpdss2funsd.stretchoid.com | 2 |
| 116.211.203.35.bc.googleusercontent.com | 1 |
| 189.210.203.35.bc.googleusercontent.com | 1 |
| 205.210.31.200 | 1 |
| 51.159.234.118 | 1 |
| census9.shodan.io | 1 |
| scanner-202.ch1.censys-scanner.com | 1 |
| TOTAL: 12 | 33 |
NNRP gethostbyaddr failures [Top 20]:
| System | Conn |
|---|---|
| ? (can't getpeername) | 9 |
| TOTAL: 1 | 9 |
NNRP unrecognized commands (by host) [Top 20]:
| System | Conn |
|---|---|
| 65.150.216.162.bc.googleusercontent.com | 12 |
| 116.211.203.35.bc.googleusercontent.com | 4 |
| 16.149.216.162.bc.googleusercontent.com | 4 |
| 189.210.203.35.bc.googleusercontent.com | 4 |
| 167.94.138.203 | 1 |
| azpdss2funsd.stretchoid.com | 1 |
| o304.scanner.modat.io | 1 |
| scanner-202.ch1.censys-scanner.com | 1 |
| TOTAL: 8 | 28 |
NNRP unrecognized commands (by command) [Top 20]:
| Command | Count |
|---|---|
| GET / HTTP/1.1 | 6 |
| Host: 109.238.130.155:563 | 6 |
| Accept: */* | 4 |
| User-Agent: curl/7.68.0 | 4 |
| Accept-Encoding: gzip | 2 |
| EHLO www.censys.io | 2 |
| User-Agent: Hello from Palo Alto Network... | 2 |
| HELO | 1 |
| MGLNDD_109.238.130.155_119 | 1 |
| TOTAL: 9 | 28 |
NNRP client timeouts [Top 20]:
| System | Conn | Peer |
|---|---|---|
| 65.150.216.162.bc.googleusercontent.com | 3 | 5 |
| 116.211.203.35.bc.googleusercontent.com | 1 | 1 |
| 16.149.216.162.bc.googleusercontent.com | 1 | 2 |
| 167.94.138.203 | 1 | 2 |
| 189.210.203.35.bc.googleusercontent.com | 1 | 1 |
| o304.scanner.modat.io | 1 | 1 |
| TOTAL: 6 | 8 | 13 |
Newsgroup request counts (by hierarchy):
| Hierarchy | Count | Pct | |
|---|---|---|---|
| 1 | alt | 12 | 100.0% |
| TOTAL: 1 | 12 | 100.0% | |
Newsgroup request counts (by newsgroup) [Top 100]:
| Newsgroup | Count | |
|---|---|---|
| 1 | alt.2600 | 12 |
| TOTAL: 1 | 12 | |