Unknown entries from news log file:
First 1 / 1 lines (100.0%)
Log entries by program:
| Program name | Lines | %Lines | Size | %Size |
|---|---|---|---|---|
| inn | 258756 | 61.4% | 31.2 MB | 64.7% |
| innd | 160200 | 38.0% | 16.7 MB | 34.7% |
| innfeed | 2423 | 0.6% | 245.5 KB | 0.5% |
| nnrpd | 312 | 0.1% | 31.3 KB | 0.1% |
| controlchan | 1 | 0.0% | 0.1 KB | 0.0% |
| TOTAL: 5 | 421692 | 100.0% | 48.2 MB | 100.0% |
History cache:
| Reason | Count | %Count |
|---|---|---|
| Do not exist | 258345 | 49.9% |
| Negative hits | 258261 | 49.9% |
| Cache misses | 1123 | 0.2% |
| Positive hits | 214 | 0.0% |
| TOTAL: 4 | 517943 | 100.0% |
INND timer:
| Code region | Time | Pct | Invoked | Min(ms) | Avg(ms) | Max(ms) |
|---|---|---|---|---|---|---|
| article cancel | 00:00:00.592 | 0.0% | 128 | 0.000 | 4.625 | 20.000 |
| article cleanup | 00:00:01.172 | 0.0% | 258573 | 0.000 | 0.005 | 0.138 |
| article logging | 00:00:03.617 | 0.0% | 258811 | 0.000 | 0.014 | 0.088 |
| article parse | 00:00:02.212 | 0.0% | 781583 | 0.000 | 0.003 | 0.013 |
| article write | 00:05:39.418 | 0.4% | 105754 | 0.000 | 3.210 | 63.084 |
| artlog/artparse | 00:00:00.000 | 0.0% | 1 | 0.000 | 0.000 | 0.000 |
| artlog/artwrite | 00:00:00.000 | 0.0% | 0 | 0.000 | 0.000 | 0.000 |
| data move | 00:00:00.261 | 0.0% | 790977 | 0.000 | 0.000 | 0.008 |
| hisgrep/artcncl | 00:00:00.024 | 0.0% | 128 | 0.000 | 0.188 | 1.000 |
| hishave/artparse | 00:00:00.000 | 0.0% | 1 | 0.000 | 0.000 | 0.000 |
| hissync/artwrite | 00:00:00.000 | 0.0% | 0 | 0.000 | 0.000 | 0.000 |
| history grep | 00:00:00.000 | 0.0% | 0 | 0.000 | 0.000 | 0.000 |
| history lookup | 00:22:50.725 | 1.6% | 518480 | 0.003 | 2.644 | 9.960 |
| history sync | 00:00:00.006 | 0.0% | 303 | 0.000 | 0.020 | 1.000 |
| history write | 00:04:07.636 | 0.3% | 258569 | 0.000 | 0.958 | 6.302 |
| hiswrite/artparse | 00:00:00.000 | 0.0% | 1 | 0.000 | 0.000 | 0.000 |
| idle | 23:21:15.021 | 97.3% | 783219 | 20.776 | 107.345 | 60047.000 |
| nntp read | 00:00:06.412 | 0.0% | 782952 | 0.000 | 0.008 | 0.130 |
| overview write | 00:00:14.632 | 0.0% | 105754 | 0.000 | 0.138 | 8.255 |
| perl filter | 00:04:59.356 | 0.3% | 258569 | 0.223 | 1.158 | 5.567 |
| python filter | 00:00:14.265 | 0.0% | 518475 | 0.000 | 0.028 | 0.364 |
| site send | 00:00:00.912 | 0.0% | 105754 | 0.000 | 0.009 | 0.250 |
| TOTAL: 24:00:15.829 | 23:59:36.261 | 100.0% | - | - | - | - |
INNfeed timer:
| Code region | Time | Pct | Invoked | Min(ms) | Avg(ms) | Max(ms) |
|---|---|---|---|---|---|---|
| article new | 00:00:00.345 | 0.0% | 528192 | 0.000 | 0.001 | 0.053 |
| article prepare | 00:00:00.112 | 0.0% | 1967702 | 0.000 | 0.000 | 0.009 |
| article read | 00:44:26.804 | 3.1% | 491947 | 0.000 | 5.421 | 11.580 |
| backlog stats | 00:00:00.161 | 0.0% | 555524 | 0.000 | 0.000 | 0.026 |
| callbacks | 00:00:00.000 | 0.0% | 0 | 0.000 | 0.000 | 0.000 |
| data read | 00:00:02.842 | 0.0% | 489049 | 0.000 | 0.006 | 0.082 |
| data write | 00:00:06.535 | 0.0% | 383295 | 0.000 | 0.017 | 0.231 |
| idle | 23:14:47.584 | 96.9% | 555524 | 0.047 | 150.646 | 20053.000 |
| status file | 00:00:00.137 | 0.0% | 213 | 0.000 | 0.643 | 48.000 |
| TOTAL: 23:59:35.295 | 23:59:24.520 | 100.0% | - | - | - | - |
nnrpd timer:
| Code region | Time | Pct | Invoked | Min(ms) | Avg(ms) | Max(ms) |
|---|---|---|---|---|---|---|
| idle | 00:00:40.857 | 42.9% | 115 | 40.000 | 355.278 | 5738.000 |
| newnews | 00:00:00.000 | 0.0% | 0 | 0.000 | 0.000 | 0.000 |
| nntpwrite | 00:00:00.003 | 0.0% | 491 | 0.000 | 0.006 | 0.500 |
| TOTAL: 00:01:35.234 | 00:00:40.860 | 42.9% | - | - | - | - |
Control commands to INND:
| Command | Number |
|---|---|
| flush | 2 |
| flushlogs | 2 |
| go | 2 |
| logmode | 2 |
| lowmark | 1 |
| mode | 145 |
| name | 2 |
| pause | 2 |
| paused | 2 |
| reload | 2 |
| reserve | 2 |
| TOTAL: 11 | 164 |
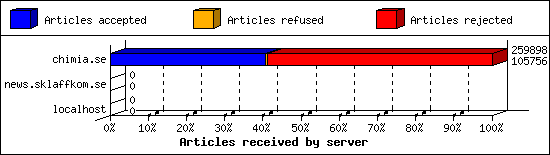
Incoming Feeds (INN):
| Server | Connects | Offered | Taken | Refused | Reject | %Accpt | Elapsed | |
|---|---|---|---|---|---|---|---|---|
| 1 | chimia.se | 1 | 259898 | 105756 | 1332 | 152810 | 40% | 23:58:28 |
| 2 | localhost | 25 | 0 | 0 | 0 | 0 | 0% | 00:00:00 |
| 3 | news.sklaffkom.se | 1 | 0 | 0 | 0 | 0 | 0% | 00:10:01 |
| TOTAL: 3 | 27 | 259898 | 105756 | 1332 | 152810 | 40% | 24:08:29 | |
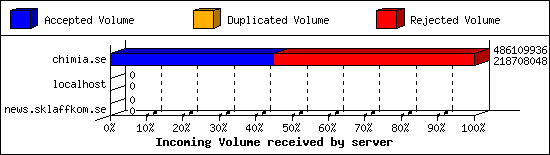
Incoming Volume (INN):
| Server | AcceptVol | DupVol | RejVol | TotalVol | %Acc | Vol/Art | |
|---|---|---|---|---|---|---|---|
| 1 | chimia.se | 208.6 MB | 52.4 KB | 255.0 MB | 463.6 MB | 44% | 1.8 KB |
| 2 | localhost | 0.0 KB | 0.0 KB | 0.0 KB | 0.0 KB | 0% | 0 |
| 3 | news.sklaffkom.se | 0.0 KB | 0.0 KB | 0.0 KB | 0.0 KB | 0% | 0 |
| TOTAL: 3 | 208.6 MB | 52.4 KB | 255.0 MB | 463.6 MB | 44% | 1.8 KB | |
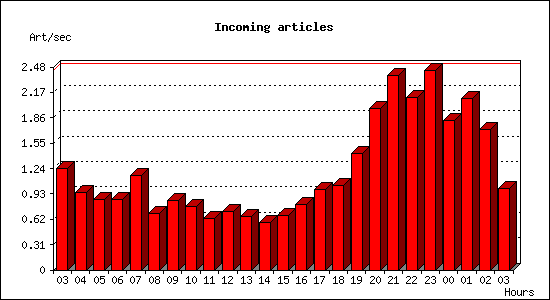
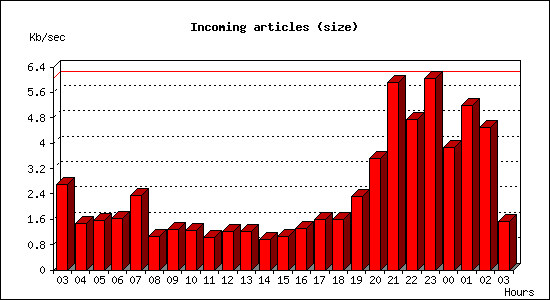
Incoming articles:
| Date | Articles | %Arts | Art/sec | Size | %Size | KB/sec |
|---|---|---|---|---|---|---|
| Dec 11 03:00:02 - 03:59:59 | 4446 | 4.2% | 1.24 | 9.5 MB | 4.5% | 2.69 |
| Dec 11 04:00:00 - 04:59:59 | 3421 | 3.2% | 0.95 | 5.2 MB | 2.5% | 1.48 |
| Dec 11 05:00:00 - 05:59:59 | 3081 | 2.9% | 0.86 | 5.4 MB | 2.6% | 1.55 |
| Dec 11 06:00:00 - 06:59:59 | 3085 | 2.9% | 0.86 | 5.7 MB | 2.8% | 1.63 |
| Dec 11 07:00:00 - 07:59:59 | 4170 | 3.9% | 1.16 | 8.3 MB | 4.0% | 2.36 |
| Dec 11 08:00:00 - 08:59:59 | 2478 | 2.3% | 0.69 | 3.7 MB | 1.8% | 1.06 |
| Dec 11 09:00:00 - 09:59:59 | 3036 | 2.9% | 0.84 | 4.5 MB | 2.2% | 1.29 |
| Dec 11 10:00:00 - 10:59:59 | 2798 | 2.6% | 0.78 | 4.4 MB | 2.1% | 1.25 |
| Dec 11 11:00:00 - 11:59:59 | 2270 | 2.1% | 0.63 | 3.6 MB | 1.7% | 1.02 |
| Dec 11 12:00:00 - 12:59:59 | 2562 | 2.4% | 0.71 | 4.2 MB | 2.0% | 1.21 |
| Dec 11 13:00:00 - 13:59:59 | 2338 | 2.2% | 0.65 | 4.3 MB | 2.1% | 1.22 |
| Dec 11 14:00:00 - 14:59:59 | 2090 | 2.0% | 0.58 | 3.3 MB | 1.6% | 0.95 |
| Dec 11 15:00:00 - 15:59:59 | 2404 | 2.3% | 0.67 | 3.7 MB | 1.8% | 1.05 |
| Dec 11 16:00:00 - 16:59:59 | 2874 | 2.7% | 0.80 | 4.6 MB | 2.2% | 1.30 |
| Dec 11 17:00:00 - 17:59:59 | 3562 | 3.4% | 0.99 | 5.6 MB | 2.7% | 1.59 |
| Dec 11 18:00:00 - 18:59:59 | 3702 | 3.5% | 1.03 | 5.6 MB | 2.7% | 1.60 |
| Dec 11 19:00:00 - 19:59:59 | 5119 | 4.8% | 1.42 | 8.2 MB | 3.9% | 2.32 |
| Dec 11 20:00:00 - 20:59:59 | 7090 | 6.7% | 1.97 | 12.4 MB | 6.0% | 3.53 |
| Dec 11 21:00:00 - 21:59:59 | 8557 | 8.1% | 2.38 | 20.8 MB | 9.9% | 5.90 |
| Dec 11 22:00:00 - 22:59:59 | 7572 | 7.2% | 2.10 | 16.7 MB | 8.0% | 4.75 |
| Dec 11 23:00:00 - 23:59:59 | 8790 | 8.3% | 2.44 | 21.3 MB | 10.2% | 6.05 |
| Dec 12 00:00:00 - 00:59:59 | 6568 | 6.2% | 1.82 | 13.5 MB | 6.5% | 3.85 |
| Dec 12 01:00:00 - 01:59:59 | 7547 | 7.1% | 2.10 | 18.3 MB | 8.8% | 5.20 |
| Dec 12 02:00:00 - 02:59:59 | 6190 | 5.9% | 1.72 | 15.8 MB | 7.6% | 4.50 |
| Dec 12 03:00:00 - 03:00:01 | 1 | 0.0% | 1.00 | 1.5 KB | 0.0% | 1.54 |
| TOTAL: 23:59:59 | 105751 | 100.0% | 1.22 | 208.6 MB | 100.0% | 2.47 |
Sites sending bad articles:
| Server | Total | Group | Dist | Duplic | Unapp | TooOld | Site | Line | Other | |
|---|---|---|---|---|---|---|---|---|---|---|
| 1 | chimia.se | 153005 | 0 | 0 | 4 | 0 | 0 | 0 | 0 | 153001 |
| TOTAL: 1 | 153005 | 0 | 0 | 4 | 0 | 0 | 0 | 0 | 153001 | |
INND Perl filter [Top 20]:
| Reason | Count |
|---|---|
| EMP (phn path) | 90532 |
| EMP (phn nph) | 32534 |
| EMP (phl) | 27198 |
| EMP (md5) | 1799 |
| HTML Multipart | 238 |
| Binary: misplaced binary | 218 |
| Too many newsgroups (meow) | 106 |
| Too many newsgroups (low_xpost) | 75 |
| MI5 Filter | 29 |
| HTML post | 10 |
| Scoring filter | 7 |
| Subject Rejected | 6 |
| HTML Image Tags | 5 |
| hierarchy violation - crosspost outside sdnet | 2 |
| Binary Image: misplaced gif | 1 |
| PFM bot misc | 1 |
| hierarchy violation - crosspost outside netscape | 1 |
| TOTAL: 17 | 152762 |
Miscellaneous innd statistics [Top 10]:
| Event | Server | Number |
|---|---|---|
| Bad Message-ID's offered | ||
| chimia.se | 8 | |
| TOTAL: 1 | 8 | |
| Huge articles | ||
| chimia.se | 1 | |
| TOTAL: 1 | 1 | |
| Including strange strings | ||
| chimia.se | 238 | |
| TOTAL: 1 | 238 | |
| TOTAL: 3 | 247 | |
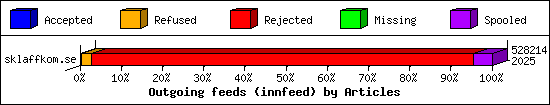
Outgoing Feeds (innfeed) by Articles:
| Server | Offered | Taken | Refused | Reject | Miss | Spool | %Took | Elapsed | |
|---|---|---|---|---|---|---|---|---|---|
| 1 | sklaffkom.se | 504305 | 2025 | 12328 | 489909 | 43 | 23909 | 0% | 23:59:57 |
| 2 | sklaff.dev | 0 | 0 | 0 | 0 | 0 | 105743 | 0% | 23:57:43 |
| 3 | thebunker.nu | 0 | 0 | 0 | 0 | 0 | 105743 | 0% | 23:59:57 |
| 4 | usenet.blueworldhosting.com | 0 | 0 | 0 | 0 | 0 | 38205 | 0% | 23:59:57 |
| TOTAL: 4 | 504305 | 2025 | 12328 | 489909 | 43 | 273600 | 0% | 95:57:34 | |
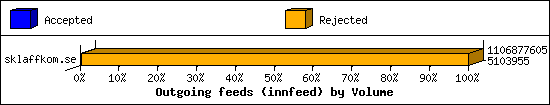
Outgoing Feeds (innfeed) by Volume:
| Server | AcceptVol | RejectVol | TotalVol | Volume/sec | Vol/Art | Elapsed | |
|---|---|---|---|---|---|---|---|
| 1 | sklaffkom.se | 4.9 MB | 1.0 GB | 1.0 GB | 12.5 KB/s | 2.2 KB | 23:59:57 |
| 2 | sklaff.dev | 0.0 KB | 0.0 KB | 0.0 KB | 0.0 KB/s | 0 | 23:57:43 |
| 3 | thebunker.nu | 0.0 KB | 0.0 KB | 0.0 KB | 0.0 KB/s | 0 | 23:59:57 |
| 4 | usenet.blueworldhosting.com | 0.0 KB | 0.0 KB | 0.0 KB | 0.0 KB/s | 0 | 23:59:57 |
| TOTAL: 4 | 4.9 MB | 1.0 GB | 1.0 GB | 3.1 KB/s | 2.2 KB | 95:57:34 | |
NNRP readership statistics:
| System | Conn | Arts | Size | Groups | Post | Rej | Elapsed | |
|---|---|---|---|---|---|---|---|---|
| 1 | 66.61.98.95 | 10 | 0 | 0.0 KB | 0 | 0 | 0 | 00:00:07 |
| 2 | 54.38.193.48 | 5 | 0 | 0.0 KB | 0 | 0 | 0 | 00:00:00 |
| 3 | 147.185.133.215 | 4 | 0 | 0.0 KB | 0 | 0 | 0 | 00:00:32 |
| 4 | c-5eea44a8-74736162.cust.telenor.se | 4 | 0 | 0.0 KB | 0 | 0 | 0 | 00:00:03 |
| 5 | 167.94.146.49 | 3 | 0 | 0.0 KB | 0 | 0 | 0 | 00:00:03 |
| 6 | 199.45.154.142 | 3 | 0 | 0.0 KB | 0 | 0 | 0 | 00:00:06 |
| 7 | 66.132.153.122 | 3 | 0 | 0.0 KB | 0 | 0 | 0 | 00:00:05 |
| 8 | scanner-07.ch1.censys-scanner.com | 3 | 0 | 0.0 KB | 0 | 0 | 0 | 00:00:07 |
| 9 | 145.211.203.35.bc.googleusercontent.com | 2 | 0 | 0.0 KB | 0 | 0 | 0 | 00:00:12 |
| 10 | c-5eea45ca-74736162.cust.telenor.se | 2 | 0 | 0.0 KB | 0 | 0 | 0 | 00:00:01 |
| 11 | 104.152.52.61 | 1 | 0 | 0.0 KB | 0 | 0 | 0 | 00:00:00 |
| 12 | 147.185.133.17 | 1 | 0 | 0.0 KB | 0 | 0 | 0 | 00:00:05 |
| 13 | 205.210.31.71 | 1 | 0 | 0.0 KB | 0 | 0 | 0 | 00:00:00 |
| 14 | 28.210.203.35.bc.googleusercontent.com | 1 | 0 | 0.0 KB | 0 | 0 | 0 | 00:00:00 |
| 15 | c-5eea5bec-74736162.cust.telenor.se | 1 | 0 | 0.0 KB | 0 | 0 | 0 | 00:00:04 |
| 16 | prod-beryllium-nyc1-112.do.binaryedge.ninja | 1 | 0 | 0.0 KB | 0 | 0 | 0 | 00:00:02 |
| 17 | vivacious.monitoring.internet-measurement.com | 1 | 0 | 0.0 KB | 0 | 0 | 0 | 00:00:01 |
| TOTAL: 17 | 46 | 0 | 0.0 KB | 0 | 0 | 0 | 00:01:35 | |
NNRP readership statistics (by domain):
| System | Conn | Arts | Size | Groups | Post | Rej | Elapsed | |
|---|---|---|---|---|---|---|---|---|
| 1 | unresolved | 31 | 0 | 0.0 KB | 0 | 0 | 0 | 00:01:01 |
| 2 | *.cust.telenor.se | 7 | 0 | 0.0 KB | 0 | 0 | 0 | 00:00:08 |
| 3 | *.ch1.censys-scanner.com | 3 | 0 | 0.0 KB | 0 | 0 | 0 | 00:00:07 |
| 4 | *.211.203.35.bc.googleusercontent.com | 2 | 0 | 0.0 KB | 0 | 0 | 0 | 00:00:12 |
| 5 | *.210.203.35.bc.googleusercontent.com | 1 | 0 | 0.0 KB | 0 | 0 | 0 | 00:00:00 |
| 6 | *.do.binaryedge.ninja | 1 | 0 | 0.0 KB | 0 | 0 | 0 | 00:00:02 |
| 7 | *.monitoring.internet-measurement.com | 1 | 0 | 0.0 KB | 0 | 0 | 0 | 00:00:01 |
| TOTAL: 7 | 46 | 0 | 0.0 KB | 0 | 0 | 0 | 00:01:35 | |
NNRP auth users [Top 20]:
| User | Conn |
|---|---|
| peterlondon | 7 |
| TOTAL: 1 | 7 |
NNRP total resource statistics [Top 20]:
| System | User(ms) | System(ms) | Idle(ms) | Elapsed |
|---|---|---|---|---|
| 147.185.133.215 | 0.156 | 0.025 | 0.000 | 00:00:32 |
| 145.211.203.35.bc.googleusercontent.com | 0.079 | 0.013 | 0.000 | 00:00:12 |
| 66.61.98.95 | 0.074 | 0.054 | 0.000 | 00:00:07 |
| scanner-07.ch1.censys-scanner.com | 0.054 | 0.020 | 0.000 | 00:00:07 |
| 199.45.154.142 | 0.067 | 0.020 | 0.000 | 00:00:06 |
| 66.132.153.122 | 0.054 | 0.015 | 0.000 | 00:00:05 |
| 147.185.133.17 | 0.041 | 0.004 | 0.000 | 00:00:05 |
| c-5eea5bec-74736162.cust.telenor.se | 0.007 | 0.006 | 0.050 | 00:00:04 |
| 167.94.146.49 | 0.051 | 0.014 | 0.000 | 00:00:03 |
| c-5eea44a8-74736162.cust.telenor.se | 0.031 | 0.023 | 0.139 | 00:00:03 |
| prod-beryllium-nyc1-112.do.binaryedge.ninja | 0.008 | 0.005 | 0.000 | 00:00:02 |
| vivacious.monitoring.internet-measurement.com | 0.009 | 0.005 | 0.000 | 00:00:01 |
| c-5eea45ca-74736162.cust.telenor.se | 0.014 | 0.014 | 0.099 | 00:00:01 |
| 205.210.31.71 | 0.009 | 0.002 | 0.000 | 00:00:00 |
| 54.38.193.48 | 0.221 | 0.035 | 0.000 | 00:00:00 |
| 104.152.52.61 | 0.007 | 0.007 | 0.000 | 00:00:00 |
| 28.210.203.35.bc.googleusercontent.com | 0.041 | 0.007 | 0.000 | 00:00:00 |
| TOTAL: 17 | 0.923 | 0.269 | 0.288 | 00:01:35 |
NNRP gethostbyaddr failures [Top 20]:
| System | Conn |
|---|---|
| ? (can't getpeername) | 9 |
| TOTAL: 1 | 9 |
NNRP unrecognized commands (by host) [Top 20]:
| System | Conn |
|---|---|
| 147.185.133.215 | 8 |
| 145.211.203.35.bc.googleusercontent.com | 4 |
| 147.185.133.17 | 4 |
| 28.210.203.35.bc.googleusercontent.com | 4 |
| 167.94.146.49 | 1 |
| 199.45.154.142 | 1 |
| 54.38.193.48 | 1 |
| 66.132.153.122 | 1 |
| scanner-07.ch1.censys-scanner.com | 1 |
| TOTAL: 9 | 25 |
NNRP unrecognized commands (by command) [Top 20]:
| Command | Count |
|---|---|
| GET / HTTP/1.1 | 5 |
| Host: 109.238.130.155:563 | 5 |
| EHLO www.censys.io | 4 |
| Accept: */* | 3 |
| User-Agent: curl/7.68.0 | 3 |
| Accept-Encoding: gzip | 2 |
| User-Agent: Hello from Palo Alto Network... | 2 |
| HELO | 1 |
| TOTAL: 8 | 25 |
NNRP client timeouts [Top 20]:
| System | Conn | Peer |
|---|---|---|
| 147.185.133.215 | 2 | 4 |
| 145.211.203.35.bc.googleusercontent.com | 1 | 2 |
| 147.185.133.17 | 1 | 1 |
| 167.94.146.49 | 1 | 2 |
| 199.45.154.142 | 1 | 2 |
| 28.210.203.35.bc.googleusercontent.com | 1 | 1 |
| 54.38.193.48 | 1 | 1 |
| 66.132.153.122 | 1 | 2 |
| scanner-07.ch1.censys-scanner.com | 1 | 2 |
| TOTAL: 9 | 10 | 18 |