
Unknown entries from news log file:
First 1 / 1 lines (100.0%)
Log entries by program:
| Program name | Lines | %Lines | Size | %Size |
|---|---|---|---|---|
| inn | 262619 | 60.6% | 32.0 MB | 65.3% |
| innd | 167789 | 38.7% | 16.7 MB | 34.1% |
| innfeed | 2407 | 0.6% | 247.4 KB | 0.5% |
| nnrpd | 210 | 0.0% | 21.2 KB | 0.0% |
| controlchan | 1 | 0.0% | 0.1 KB | 0.0% |
| TOTAL: 5 | 433026 | 100.0% | 49.0 MB | 100.0% |
History cache:
| Reason | Count | %Count |
|---|---|---|
| Do not exist | 262443 | 50.0% |
| Negative hits | 262407 | 49.9% |
| Positive hits | 260 | 0.0% |
| Cache misses | 232 | 0.0% |
| TOTAL: 4 | 525342 | 100.0% |
INND timer:
| Code region | Time | Pct | Invoked | Min(ms) | Avg(ms) | Max(ms) |
|---|---|---|---|---|---|---|
| article cancel | 00:00:00.107 | 0.0% | 3 | 35.667 | 35.667 | 35.667 |
| article cleanup | 00:00:01.057 | 0.0% | 262614 | 0.000 | 0.004 | 0.144 |
| article logging | 00:00:03.617 | 0.0% | 262620 | 0.000 | 0.014 | 0.093 |
| article parse | 00:00:02.367 | 0.0% | 791348 | 0.000 | 0.003 | 0.013 |
| article write | 00:03:04.249 | 0.2% | 102158 | 0.000 | 1.804 | 220.083 |
| artlog/artparse | 00:00:00.000 | 0.0% | 0 | 0.000 | 0.000 | 0.000 |
| artlog/artwrite | 00:00:00.000 | 0.0% | 0 | 0.000 | 0.000 | 0.000 |
| data move | 00:00:00.258 | 0.0% | 802234 | 0.000 | 0.000 | 0.008 |
| hisgrep/artcncl | 00:00:00.000 | 0.0% | 3 | 0.000 | 0.000 | 0.000 |
| hishave/artparse | 00:00:00.000 | 0.0% | 0 | 0.000 | 0.000 | 0.000 |
| hissync/artwrite | 00:00:00.000 | 0.0% | 0 | 0.000 | 0.000 | 0.000 |
| history grep | 00:00:00.000 | 0.0% | 0 | 0.000 | 0.000 | 0.000 |
| history lookup | 00:19:03.870 | 1.3% | 525720 | 0.000 | 2.176 | 11.085 |
| history sync | 00:00:00.006 | 0.0% | 295 | 0.000 | 0.020 | 1.000 |
| history write | 00:04:29.197 | 0.3% | 262614 | 0.000 | 1.025 | 8.088 |
| hiswrite/artparse | 00:00:00.000 | 0.0% | 0 | 0.000 | 0.000 | 0.000 |
| idle | 23:26:27.777 | 97.7% | 792107 | 19.893 | 106.536 | 60060.000 |
| nntp read | 00:00:06.027 | 0.0% | 791868 | 0.000 | 0.008 | 0.137 |
| overview write | 00:00:09.813 | 0.0% | 102158 | 0.000 | 0.096 | 24.000 |
| perl filter | 00:05:42.747 | 0.4% | 262614 | 0.373 | 1.305 | 9.841 |
| python filter | 00:00:12.891 | 0.0% | 525720 | 0.000 | 0.025 | 0.360 |
| site send | 00:00:00.854 | 0.0% | 102158 | 0.000 | 0.008 | 0.500 |
| TOTAL: 24:00:05.426 | 23:59:24.837 | 100.0% | - | - | - | - |
INNfeed timer:
| Code region | Time | Pct | Invoked | Min(ms) | Avg(ms) | Max(ms) |
|---|---|---|---|---|---|---|
| article new | 00:00:00.150 | 0.0% | 102157 | 0.000 | 0.001 | 0.054 |
| article prepare | 00:00:00.030 | 0.0% | 399448 | 0.000 | 0.000 | 0.008 |
| article read | 00:00:45.095 | 0.1% | 99862 | 0.000 | 0.452 | 31.000 |
| backlog stats | 00:00:00.140 | 0.0% | 511144 | 0.000 | 0.000 | 0.333 |
| callbacks | 00:00:00.000 | 0.0% | 0 | 0.000 | 0.000 | 0.000 |
| data read | 00:00:01.967 | 0.0% | 304205 | 0.000 | 0.006 | 0.333 |
| data write | 00:00:03.231 | 0.0% | 202109 | 0.000 | 0.016 | 0.500 |
| idle | 23:58:48.506 | 99.9% | 511144 | 25.466 | 168.893 | 30100.000 |
| status file | 00:00:00.111 | 0.0% | 204 | 0.000 | 0.544 | 8.500 |
| TOTAL: 23:59:44.643 | 23:59:39.230 | 100.0% | - | - | - | - |
nnrpd timer:
| Code region | Time | Pct | Invoked | Min(ms) | Avg(ms) | Max(ms) |
|---|---|---|---|---|---|---|
| idle | 00:00:40.330 | 42.1% | 79 | 66.500 | 510.506 | 10050.000 |
| newnews | 00:00:00.000 | 0.0% | 0 | 0.000 | 0.000 | 0.000 |
| nntpwrite | 00:00:00.003 | 0.0% | 396 | 0.000 | 0.008 | 0.333 |
| readart | 00:00:00.248 | 0.3% | 18 | 3.000 | 13.778 | 34.000 |
| TOTAL: 00:01:35.794 | 00:00:40.581 | 42.4% | - | - | - | - |
Control commands to INND:
| Command | Number |
|---|---|
| flush | 2 |
| flushlogs | 2 |
| go | 2 |
| logmode | 2 |
| lowmark | 1 |
| mode | 139 |
| name | 2 |
| pause | 2 |
| paused | 2 |
| reload | 2 |
| reserve | 2 |
| TOTAL: 11 | 158 |
Incoming Feeds (INN):
| Server | Connects | Offered | Taken | Refused | Reject | %Accpt | Elapsed | |
|---|---|---|---|---|---|---|---|---|
| 1 | chimia.se | 1 | 263100 | 102167 | 492 | 160441 | 38% | 23:55:00 |
| 2 | localhost | 25 | 0 | 0 | 0 | 0 | 0% | 00:00:00 |
| TOTAL: 2 | 26 | 263100 | 102167 | 492 | 160441 | 38% | 23:55:00 | |
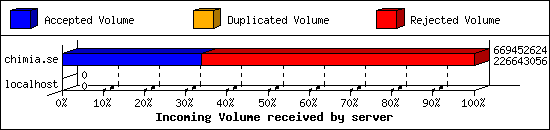
Incoming Volume (INN):
| Server | AcceptVol | DupVol | RejVol | TotalVol | %Acc | Vol/Art | |
|---|---|---|---|---|---|---|---|
| 1 | chimia.se | 216.1 MB | 0.0 KB | 422.3 MB | 638.4 MB | 33% | 2.5 KB |
| 2 | localhost | 0.0 KB | 0.0 KB | 0.0 KB | 0.0 KB | 0% | 0 |
| TOTAL: 2 | 216.1 MB | 0.0 KB | 422.3 MB | 638.4 MB | 33% | 2.5 KB | |
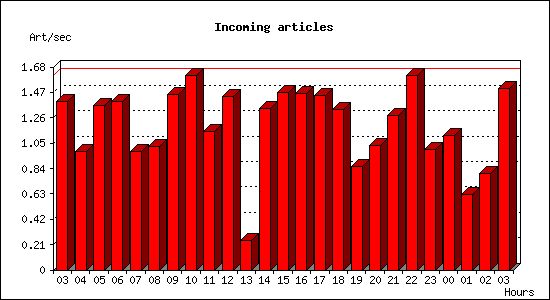
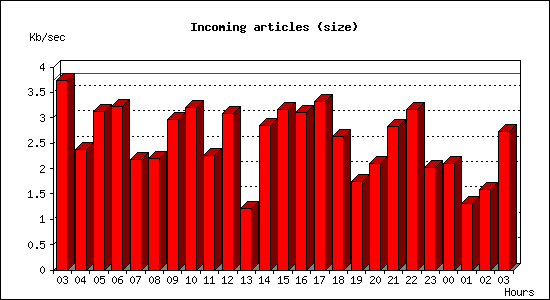
Incoming articles:
| Date | Articles | %Arts | Art/sec | Size | %Size | KB/sec |
|---|---|---|---|---|---|---|
| Dec 21 03:00:01 - 03:59:59 | 5014 | 4.9% | 1.39 | 13.1 MB | 6.1% | 3.74 |
| Dec 21 04:00:00 - 04:59:59 | 3522 | 3.4% | 0.98 | 8.4 MB | 3.9% | 2.38 |
| Dec 21 05:00:00 - 05:59:59 | 4906 | 4.8% | 1.36 | 11.0 MB | 5.1% | 3.13 |
| Dec 21 06:00:00 - 06:59:59 | 5028 | 4.9% | 1.40 | 11.3 MB | 5.2% | 3.21 |
| Dec 21 07:00:00 - 07:59:59 | 3516 | 3.4% | 0.98 | 7.6 MB | 3.5% | 2.17 |
| Dec 21 08:00:00 - 08:59:59 | 3693 | 3.6% | 1.03 | 7.7 MB | 3.6% | 2.20 |
| Dec 21 09:00:00 - 09:59:59 | 5230 | 5.1% | 1.45 | 10.4 MB | 4.8% | 2.97 |
| Dec 21 10:00:00 - 10:59:59 | 5793 | 5.7% | 1.61 | 11.2 MB | 5.2% | 3.19 |
| Dec 21 11:00:00 - 11:59:59 | 4140 | 4.1% | 1.15 | 7.9 MB | 3.7% | 2.26 |
| Dec 21 12:00:00 - 12:59:59 | 5182 | 5.1% | 1.44 | 10.8 MB | 5.0% | 3.07 |
| Dec 21 13:00:00 - 13:59:59 | 870 | 0.9% | 0.24 | 4.3 MB | 2.0% | 1.21 |
| Dec 21 14:00:00 - 14:59:59 | 4818 | 4.7% | 1.34 | 10.0 MB | 4.6% | 2.85 |
| Dec 21 15:00:00 - 15:59:59 | 5293 | 5.2% | 1.47 | 11.1 MB | 5.1% | 3.16 |
| Dec 21 16:00:00 - 16:59:59 | 5260 | 5.1% | 1.46 | 10.9 MB | 5.0% | 3.10 |
| Dec 21 17:00:00 - 17:59:59 | 5200 | 5.1% | 1.44 | 11.7 MB | 5.4% | 3.33 |
| Dec 21 18:00:00 - 18:59:59 | 4779 | 4.7% | 1.33 | 9.2 MB | 4.3% | 2.63 |
| Dec 21 19:00:00 - 19:59:59 | 3084 | 3.0% | 0.86 | 6.2 MB | 2.9% | 1.75 |
| Dec 21 20:00:00 - 20:59:59 | 3710 | 3.6% | 1.03 | 7.4 MB | 3.4% | 2.10 |
| Dec 21 21:00:00 - 21:59:59 | 4613 | 4.5% | 1.28 | 9.9 MB | 4.6% | 2.82 |
| Dec 21 22:00:00 - 22:59:59 | 5800 | 5.7% | 1.61 | 11.1 MB | 5.2% | 3.17 |
| Dec 21 23:00:00 - 23:59:59 | 3599 | 3.5% | 1.00 | 7.1 MB | 3.3% | 2.01 |
| Dec 22 00:00:00 - 00:59:59 | 4004 | 3.9% | 1.11 | 7.4 MB | 3.4% | 2.11 |
| Dec 22 01:00:00 - 01:59:59 | 2250 | 2.2% | 0.62 | 4.6 MB | 2.1% | 1.31 |
| Dec 22 02:00:00 - 02:59:59 | 2864 | 2.8% | 0.80 | 5.6 MB | 2.6% | 1.59 |
| Dec 22 03:00:00 - 03:00:02 | 3 | 0.0% | 1.50 | 5.4 KB | 0.0% | 2.72 |
| TOTAL: 24:00:01 | 102171 | 100.0% | 1.18 | 216.2 MB | 100.0% | 2.56 |
Sites sending bad articles:
| Server | Total | Group | Dist | Duplic | Unapp | TooOld | Site | Line | Other | |
|---|---|---|---|---|---|---|---|---|---|---|
| 1 | chimia.se | 160448 | 0 | 0 | 0 | 0 | 0 | 0 | 0 | 160448 |
| TOTAL: 1 | 160448 | 0 | 0 | 0 | 0 | 0 | 0 | 0 | 160448 | |
INND Perl filter [Top 20]:
| Reason | Count |
|---|---|
| EMP (phn path) | 104200 |
| EMP (phn nph) | 29883 |
| EMP (phl) | 25826 |
| EMP (md5) | 237 |
| Too many newsgroups (meow) | 163 |
| HTML Multipart | 87 |
| Subject Rejected | 29 |
| MI5 Filter | 8 |
| Binary Image: misplaced gif | 2 |
| Binary Image: misplaced jpg | 2 |
| Binary Image: misplaced png | 1 |
| HTML Image Tags | 1 |
| HTML file attachment | 1 |
| Scoring filter | 1 |
| Too many newsgroups (low_xpost) | 1 |
| TOTAL: 15 | 160442 |
Miscellaneous innd statistics [Top 10]:
| Event | Server | Number |
|---|---|---|
| Bad Message-ID's offered | ||
| chimia.se | 1 | |
| TOTAL: 1 | 1 | |
| Including strange strings | ||
| chimia.se | 6 | |
| TOTAL: 1 | 6 | |
| TOTAL: 2 | 7 | |
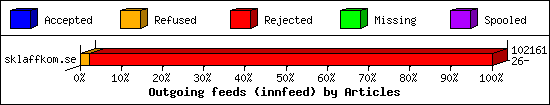
Outgoing Feeds (innfeed) by Articles:
| Server | Offered | Taken | Refused | Reject | Miss | Spool | %Took | Elapsed | |
|---|---|---|---|---|---|---|---|---|---|
| 1 | sklaffkom.se | 102161 | 26 | 2285 | 99850 | 0 | 0 | 0% | 23:53:39 |
| 2 | sklaff.dev | 0 | 0 | 0 | 0 | 0 | 102161 | 0% | 23:57:46 |
| 3 | thebunker.nu | 0 | 0 | 0 | 0 | 0 | 102161 | 0% | 23:59:56 |
| 4 | usenet.blueworldhosting.com | 0 | 0 | 0 | 0 | 0 | 101874 | 0% | 23:59:58 |
| TOTAL: 4 | 102161 | 26 | 2285 | 99850 | 0 | 306196 | 0% | 95:51:19 | |
Outgoing Feeds (innfeed) by Volume:
| Server | AcceptVol | RejectVol | TotalVol | Volume/sec | Vol/Art | Elapsed | |
|---|---|---|---|---|---|---|---|
| 1 | sklaffkom.se | 84.6 KB | 209.6 MB | 209.7 MB | 2.5 KB/s | 2.2 KB | 23:53:39 |
| 2 | sklaff.dev | 0.0 KB | 0.0 KB | 0.0 KB | 0.0 KB/s | 0 | 23:57:46 |
| 3 | thebunker.nu | 0.0 KB | 0.0 KB | 0.0 KB | 0.0 KB/s | 0 | 23:59:56 |
| 4 | usenet.blueworldhosting.com | 0.0 KB | 0.0 KB | 0.0 KB | 0.0 KB/s | 0 | 23:59:58 |
| TOTAL: 4 | 84.6 KB | 209.6 MB | 209.7 MB | 0.6 KB/s | 2.2 KB | 95:51:19 | |
NNRP readership statistics:
| System | Conn | Arts | Size | Groups | Post | Rej | Elapsed | |
|---|---|---|---|---|---|---|---|---|
| 1 | 66.61.98.95 | 18 | 18 | 57.9 KB | 9 | 0 | 0 | 00:00:30 |
| TOTAL: 1 | 18 | 18 | 57.9 KB | 9 | 0 | 0 | 00:01:35 | |
NNRP readership statistics (by domain):
| System | Conn | Arts | Size | Groups | Post | Rej | Elapsed | |
|---|---|---|---|---|---|---|---|---|
| 1 | unresolved | 26 | 18 | 57.9 KB | 9 | 0 | 0 | 00:01:11 |
| 2 | *.210.203.35.bc.googleusercontent.com | 2 | 0 | 0.0 KB | 0 | 0 | 0 | 00:00:13 |
| 3 | *.211.203.35.bc.googleusercontent.com | 2 | 0 | 0.0 KB | 0 | 0 | 0 | 00:00:00 |
| 4 | *.stretchoid.com | 2 | 0 | 0.0 KB | 0 | 0 | 0 | 00:00:10 |
| TOTAL: 4 | 32 | 18 | 57.9 KB | 9 | 0 | 0 | 00:01:35 | |
NNRP total resource statistics [Top 20]:
| System | User(ms) | System(ms) | Idle(ms) | Elapsed |
|---|---|---|---|---|
| 66.61.98.95 | 0.159 | 0.141 | 0.000 | 00:00:30 |
| 147.185.133.88 | 0.081 | 0.010 | 0.000 | 00:00:23 |
| 221.210.203.35.bc.googleusercontent.com | 0.085 | 0.004 | 0.000 | 00:00:13 |
| 66.132.153.142 | 0.055 | 0.018 | 0.000 | 00:00:10 |
| azpdsg9e0oqa.stretchoid.com | 0.018 | 0.007 | 0.000 | 00:00:10 |
| 206.168.34.44 | 0.037 | 0.008 | 0.000 | 00:00:05 |
| 198.235.24.41 | 0.005 | 0.009 | 0.000 | 00:00:01 |
| 147.185.132.171 | 0.005 | 0.009 | 0.000 | 00:00:00 |
| 223.211.203.35.bc.googleusercontent.com | 0.043 | 0.004 | 0.000 | 00:00:00 |
| 242.211.203.35.bc.googleusercontent.com | 0.043 | 0.003 | 0.000 | 00:00:00 |
| TOTAL: 10 | 0.531 | 0.213 | 0.000 | 00:01:35 |
Curious NNRP server explorers [Top 20]:
| System | Conn |
|---|---|
| 66.132.153.142 | 3 |
| 147.185.133.88 | 2 |
| 221.210.203.35.bc.googleusercontent.com | 2 |
| azpdsg9e0oqa.stretchoid.com | 2 |
| 147.185.132.171 | 1 |
| 198.235.24.41 | 1 |
| 206.168.34.44 | 1 |
| 223.211.203.35.bc.googleusercontent.com | 1 |
| 242.211.203.35.bc.googleusercontent.com | 1 |
| TOTAL: 9 | 14 |
NNRP gethostbyaddr failures [Top 20]:
| System | Conn |
|---|---|
| ? (can't getpeername) | 3 |
| TOTAL: 1 | 3 |
NNRP unrecognized commands (by host) [Top 20]:
| System | Conn |
|---|---|
| 147.185.133.88 | 4 |
| 221.210.203.35.bc.googleusercontent.com | 4 |
| 223.211.203.35.bc.googleusercontent.com | 4 |
| 242.211.203.35.bc.googleusercontent.com | 4 |
| 206.168.34.44 | 1 |
| 66.132.153.142 | 1 |
| azpdsg9e0oqa.stretchoid.com | 1 |
| TOTAL: 7 | 19 |
NNRP unrecognized commands (by command) [Top 20]:
| Command | Count |
|---|---|
| GET / HTTP/1.1 | 4 |
| Host: 109.238.130.155:563 | 4 |
| Accept-Encoding: gzip | 2 |
| Accept: */* | 2 |
| EHLO www.censys.io | 2 |
| User-Agent: Hello from Palo Alto Network... | 2 |
| User-Agent: curl/7.68.0 | 2 |
| MGLNDD_109.238.130.155_119 | 1 |
| TOTAL: 8 | 19 |
NNRP client timeouts [Top 20]:
| System | Conn | Peer |
|---|---|---|
| 147.185.133.88 | 1 | 2 |
| 221.210.203.35.bc.googleusercontent.com | 1 | 2 |
| 223.211.203.35.bc.googleusercontent.com | 1 | 1 |
| 242.211.203.35.bc.googleusercontent.com | 1 | 1 |
| 66.132.153.142 | 1 | 1 |
| TOTAL: 5 | 5 | 9 |
Newsgroup request counts (by hierarchy):
| Hierarchy | Count | Pct | |
|---|---|---|---|
| 1 | rec | 18 | 100.0% |
| TOTAL: 1 | 18 | 100.0% | |
Newsgroup request counts (by newsgroup) [Top 100]:
| Newsgroup | Count | |
|---|---|---|
| 1 | rec.collecting | 18 |
| TOTAL: 1 | 18 | |