Unknown entries from news log file:
First 1 / 1 lines (100.0%)
Log entries by program:
| Program name | Lines | %Lines | Size | %Size |
|---|---|---|---|---|
| inn | 262328 | 58.8% | 30.9 MB | 62.9% |
| innd | 180682 | 40.5% | 18.0 MB | 36.6% |
| innfeed | 2410 | 0.5% | 234.3 KB | 0.5% |
| nnrpd | 482 | 0.1% | 48.1 KB | 0.1% |
| controlchan | 1 | 0.0% | 0.1 KB | 0.0% |
| TOTAL: 5 | 445903 | 100.0% | 49.2 MB | 100.0% |
History cache:
| Reason | Count | %Count |
|---|---|---|
| Do not exist | 262222 | 49.9% |
| Negative hits | 262202 | 49.9% |
| Cache misses | 885 | 0.2% |
| Positive hits | 4 | 0.0% |
| TOTAL: 4 | 525313 | 100.0% |
INND timer:
| Code region | Time | Pct | Invoked | Min(ms) | Avg(ms) | Max(ms) |
|---|---|---|---|---|---|---|
| article cancel | 00:00:00.000 | 0.0% | 0 | 0.000 | 0.000 | 0.000 |
| article cleanup | 00:00:01.133 | 0.0% | 262359 | 0.000 | 0.004 | 0.147 |
| article logging | 00:00:03.740 | 0.0% | 262359 | 0.000 | 0.014 | 0.087 |
| article parse | 00:00:02.338 | 0.0% | 790862 | 0.000 | 0.003 | 0.012 |
| article write | 00:03:21.644 | 0.2% | 88970 | 0.000 | 2.266 | 53.000 |
| artlog/artparse | 00:00:00.000 | 0.0% | 0 | 0.000 | 0.000 | 0.000 |
| artlog/artwrite | 00:00:00.000 | 0.0% | 0 | 0.000 | 0.000 | 0.000 |
| data move | 00:00:00.244 | 0.0% | 802492 | 0.000 | 0.000 | 0.023 |
| hisgrep/artcncl | 00:00:00.000 | 0.0% | 0 | 0.000 | 0.000 | 0.000 |
| hishave/artparse | 00:00:00.000 | 0.0% | 0 | 0.000 | 0.000 | 0.000 |
| hissync/artwrite | 00:00:00.000 | 0.0% | 0 | 0.000 | 0.000 | 0.000 |
| history grep | 00:00:00.000 | 0.0% | 0 | 0.000 | 0.000 | 0.000 |
| history lookup | 00:14:14.505 | 1.0% | 525608 | 0.000 | 1.626 | 8.860 |
| history sync | 00:00:00.046 | 0.0% | 293 | 0.000 | 0.157 | 27.000 |
| history write | 00:04:25.849 | 0.3% | 262359 | 0.011 | 1.013 | 6.358 |
| hiswrite/artparse | 00:00:00.000 | 0.0% | 0 | 0.000 | 0.000 | 0.000 |
| idle | 23:31:28.037 | 98.0% | 792072 | 96.161 | 106.920 | 154.145 |
| nntp read | 00:00:06.306 | 0.0% | 791784 | 0.000 | 0.008 | 0.134 |
| overview write | 00:00:09.450 | 0.0% | 88970 | 0.000 | 0.106 | 11.000 |
| perl filter | 00:05:22.986 | 0.4% | 262359 | 0.362 | 1.231 | 3.467 |
| python filter | 00:00:11.979 | 0.0% | 525608 | 0.000 | 0.023 | 0.359 |
| site send | 00:00:00.738 | 0.0% | 88970 | 0.000 | 0.008 | 0.105 |
| TOTAL: 24:00:08.402 | 23:59:28.995 | 100.0% | - | - | - | - |
INNfeed timer:
| Code region | Time | Pct | Invoked | Min(ms) | Avg(ms) | Max(ms) |
|---|---|---|---|---|---|---|
| article new | 00:00:00.142 | 0.0% | 88873 | 0.000 | 0.002 | 0.056 |
| article prepare | 00:00:00.018 | 0.0% | 355376 | 0.000 | 0.000 | 0.005 |
| article read | 00:00:36.534 | 0.0% | 88844 | 0.000 | 0.411 | 13.000 |
| backlog stats | 00:00:00.113 | 0.0% | 449279 | 0.000 | 0.000 | 0.250 |
| callbacks | 00:00:00.000 | 0.0% | 0 | 0.000 | 0.000 | 0.000 |
| data read | 00:00:01.715 | 0.0% | 266629 | 0.000 | 0.006 | 0.333 |
| data write | 00:00:02.865 | 0.0% | 177819 | 0.000 | 0.016 | 0.143 |
| idle | 23:58:19.422 | 99.9% | 449279 | 66.486 | 192.084 | 30100.500 |
| status file | 00:00:00.074 | 0.0% | 207 | 0.000 | 0.357 | 9.667 |
| TOTAL: 23:59:05.475 | 23:59:00.883 | 100.0% | - | - | - | - |
nnrpd timer:
| Code region | Time | Pct | Invoked | Min(ms) | Avg(ms) | Max(ms) |
|---|---|---|---|---|---|---|
| idle | 00:01:18.736 | 51.6% | 199 | 34.000 | 395.658 | 10050.000 |
| newnews | 00:00:00.000 | 0.0% | 0 | 0.000 | 0.000 | 0.000 |
| nntpwrite | 00:00:00.007 | 0.0% | 844 | 0.000 | 0.008 | 0.500 |
| readart | 00:00:00.324 | 0.2% | 36 | 0.000 | 9.000 | 42.000 |
| TOTAL: 00:02:32.504 | 00:01:19.067 | 51.8% | - | - | - | - |
Control commands to INND:
| Command | Number |
|---|---|
| flush | 2 |
| flushlogs | 2 |
| go | 2 |
| logmode | 2 |
| lowmark | 1 |
| mode | 142 |
| name | 2 |
| pause | 2 |
| paused | 2 |
| reload | 2 |
| reserve | 2 |
| TOTAL: 11 | 161 |
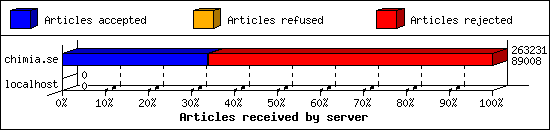
Incoming Feeds (INN):
| Server | Connects | Offered | Taken | Refused | Reject | %Accpt | Elapsed | |
|---|---|---|---|---|---|---|---|---|
| 1 | chimia.se | 0 | 263231 | 89008 | 890 | 173333 | 33% | 24:00:04 |
| 2 | localhost | 25 | 0 | 0 | 0 | 0 | 0% | 00:00:00 |
| TOTAL: 2 | 25 | 263231 | 89008 | 890 | 173333 | 33% | 24:00:04 | |
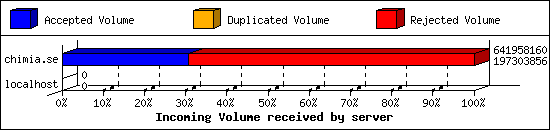
Incoming Volume (INN):
| Server | AcceptVol | DupVol | RejVol | TotalVol | %Acc | Vol/Art | |
|---|---|---|---|---|---|---|---|
| 1 | chimia.se | 188.2 MB | 0.0 KB | 424.1 MB | 612.2 MB | 30% | 2.4 KB |
| 2 | localhost | 0.0 KB | 0.0 KB | 0.0 KB | 0.0 KB | 0% | 0 |
| TOTAL: 2 | 188.2 MB | 0.0 KB | 424.1 MB | 612.2 MB | 30% | 2.4 KB | |
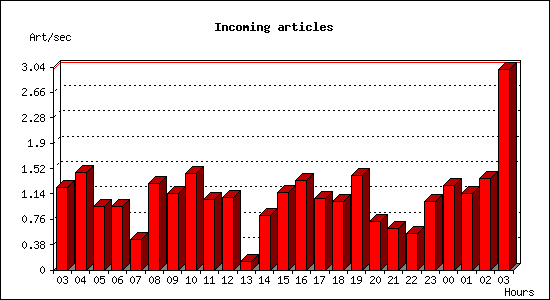
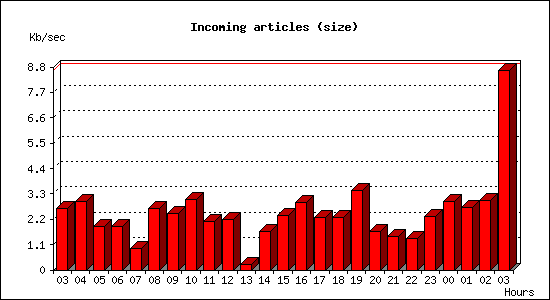
Incoming articles:
| Date | Articles | %Arts | Art/sec | Size | %Size | KB/sec |
|---|---|---|---|---|---|---|
| Dec 22 03:00:02 - 03:59:59 | 4433 | 5.0% | 1.23 | 9.4 MB | 5.0% | 2.67 |
| Dec 22 04:00:00 - 04:59:59 | 5230 | 5.9% | 1.45 | 10.4 MB | 5.5% | 2.95 |
| Dec 22 05:00:00 - 05:59:59 | 3417 | 3.8% | 0.95 | 6.7 MB | 3.5% | 1.89 |
| Dec 22 06:00:00 - 06:59:59 | 3446 | 3.9% | 0.96 | 6.7 MB | 3.5% | 1.90 |
| Dec 22 07:00:00 - 07:59:59 | 1667 | 1.9% | 0.46 | 3.3 MB | 1.7% | 0.93 |
| Dec 22 08:00:00 - 08:59:59 | 4647 | 5.2% | 1.29 | 9.4 MB | 5.0% | 2.67 |
| Dec 22 09:00:00 - 09:59:59 | 4106 | 4.6% | 1.14 | 8.7 MB | 4.6% | 2.46 |
| Dec 22 10:00:00 - 10:59:59 | 5187 | 5.8% | 1.44 | 10.7 MB | 5.7% | 3.04 |
| Dec 22 11:00:00 - 11:59:59 | 3793 | 4.3% | 1.05 | 7.4 MB | 4.0% | 2.12 |
| Dec 22 12:00:00 - 12:59:59 | 3934 | 4.4% | 1.09 | 7.7 MB | 4.1% | 2.18 |
| Dec 22 13:00:00 - 13:59:59 | 446 | 0.5% | 0.12 | 898.8 KB | 0.5% | 0.25 |
| Dec 22 14:00:00 - 14:59:59 | 2962 | 3.3% | 0.82 | 5.8 MB | 3.1% | 1.65 |
| Dec 22 15:00:00 - 15:59:59 | 4203 | 4.7% | 1.17 | 8.2 MB | 4.4% | 2.34 |
| Dec 22 16:00:00 - 16:59:59 | 4802 | 5.4% | 1.33 | 10.2 MB | 5.4% | 2.91 |
| Dec 22 17:00:00 - 17:59:59 | 3834 | 4.3% | 1.06 | 8.1 MB | 4.3% | 2.29 |
| Dec 22 18:00:00 - 18:59:59 | 3697 | 4.2% | 1.03 | 8.1 MB | 4.3% | 2.30 |
| Dec 22 19:00:00 - 19:59:59 | 5101 | 5.7% | 1.42 | 12.1 MB | 6.4% | 3.45 |
| Dec 22 20:00:00 - 20:59:59 | 2613 | 2.9% | 0.73 | 5.8 MB | 3.1% | 1.66 |
| Dec 22 21:00:00 - 21:59:59 | 2240 | 2.5% | 0.62 | 5.2 MB | 2.7% | 1.47 |
| Dec 22 22:00:00 - 22:59:59 | 1975 | 2.2% | 0.55 | 4.8 MB | 2.6% | 1.37 |
| Dec 22 23:00:00 - 23:59:59 | 3668 | 4.1% | 1.02 | 8.1 MB | 4.3% | 2.31 |
| Dec 23 00:00:00 - 00:59:59 | 4536 | 5.1% | 1.26 | 10.5 MB | 5.6% | 2.98 |
| Dec 23 01:00:00 - 01:59:59 | 4128 | 4.6% | 1.15 | 9.5 MB | 5.1% | 2.71 |
| Dec 23 02:00:00 - 02:59:59 | 4930 | 5.5% | 1.37 | 10.6 MB | 5.6% | 3.02 |
| Dec 23 03:00:00 - 03:00:02 | 6 | 0.0% | 3.00 | 17.3 KB | 0.0% | 8.64 |
| TOTAL: 24:00:00 | 89001 | 100.0% | 1.03 | 188.1 MB | 100.0% | 2.23 |
Sites sending bad articles:
| Server | Total | Group | Dist | Duplic | Unapp | TooOld | Site | Line | Other | |
|---|---|---|---|---|---|---|---|---|---|---|
| 1 | chimia.se | 173327 | 0 | 0 | 0 | 0 | 0 | 0 | 0 | 173327 |
| TOTAL: 1 | 173327 | 0 | 0 | 0 | 0 | 0 | 0 | 0 | 173327 | |
INND Perl filter [Top 20]:
| Reason | Count |
|---|---|
| EMP (phn path) | 118161 |
| EMP (phn nph) | 27270 |
| EMP (phl) | 26842 |
| EMP (md5) | 423 |
| Too many newsgroups (meow) | 256 |
| NewsAgent | 179 |
| HTML Multipart | 98 |
| Subject Rejected | 48 |
| MI5 Filter | 26 |
| Too many newsgroups | 10 |
| Too many newsgroups (low_xpost) | 5 |
| Scoring filter | 4 |
| HTML Image Tags | 3 |
| Binary Image: misplaced gif | 1 |
| Binary Image: misplaced jpg | 1 |
| TOTAL: 15 | 173327 |
Miscellaneous innd statistics [Top 10]:
| Event | Server | Number |
|---|---|---|
| Bad Message-ID's offered | ||
| chimia.se | 7 | |
| TOTAL: 1 | 7 | |
| TOTAL: 1 | 7 | |
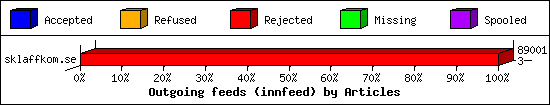
Outgoing Feeds (innfeed) by Articles:
| Server | Offered | Taken | Refused | Reject | Miss | Spool | %Took | Elapsed | |
|---|---|---|---|---|---|---|---|---|---|
| 1 | sklaffkom.se | 89001 | 3 | 29 | 88969 | 0 | 0 | 0% | 23:53:44 |
| 2 | sklaff.dev | 0 | 0 | 0 | 0 | 0 | 89001 | 0% | 23:57:45 |
| 3 | thebunker.nu | 0 | 0 | 0 | 0 | 0 | 89001 | 0% | 23:59:55 |
| 4 | usenet.blueworldhosting.com | 0 | 0 | 0 | 0 | 0 | 88926 | 0% | 23:59:57 |
| TOTAL: 4 | 89001 | 3 | 29 | 88969 | 0 | 266928 | 0% | 95:51:21 | |
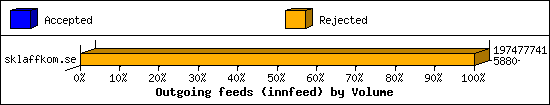
Outgoing Feeds (innfeed) by Volume:
| Server | AcceptVol | RejectVol | TotalVol | Volume/sec | Vol/Art | Elapsed | |
|---|---|---|---|---|---|---|---|
| 1 | sklaffkom.se | 5.7 KB | 188.3 MB | 188.3 MB | 2.2 KB/s | 2.2 KB | 23:53:44 |
| 2 | sklaff.dev | 0.0 KB | 0.0 KB | 0.0 KB | 0.0 KB/s | 0 | 23:57:45 |
| 3 | thebunker.nu | 0.0 KB | 0.0 KB | 0.0 KB | 0.0 KB/s | 0 | 23:59:55 |
| 4 | usenet.blueworldhosting.com | 0.0 KB | 0.0 KB | 0.0 KB | 0.0 KB/s | 0 | 23:59:57 |
| TOTAL: 4 | 5.7 KB | 188.3 MB | 188.3 MB | 0.6 KB/s | 2.2 KB | 95:51:21 | |
NNRP readership statistics:
| System | Conn | Arts | Size | Groups | Post | Rej | Elapsed | |
|---|---|---|---|---|---|---|---|---|
| 1 | 66.61.98.95 | 38 | 36 | 120.4 KB | 18 | 0 | 0 | 00:01:05 |
| TOTAL: 1 | 38 | 36 | 120.4 KB | 18 | 0 | 0 | 00:02:32 | |
NNRP readership statistics (by domain):
| System | Conn | Arts | Size | Groups | Post | Rej | Elapsed | |
|---|---|---|---|---|---|---|---|---|
| 1 | unresolved | 48 | 36 | 120.4 KB | 18 | 0 | 0 | 00:01:37 |
| 2 | *.scanner.modat.io | 12 | 0 | 0.0 KB | 0 | 0 | 0 | 00:00:02 |
| 3 | *.monitoring.internet-measurement.com | 7 | 0 | 0.0 KB | 0 | 0 | 0 | 00:00:06 |
| 4 | *.150.216.162.bc.googleusercontent.com | 4 | 0 | 0.0 KB | 0 | 0 | 0 | 00:00:35 |
| 5 | *.ip.linodeusercontent.com | 2 | 0 | 0.0 KB | 0 | 0 | 0 | 00:00:00 |
| 6 | *.stretchoid.com | 2 | 0 | 0.0 KB | 0 | 0 | 0 | 00:00:10 |
| 7 | *.210.203.35.bc.googleusercontent.com | 1 | 0 | 0.0 KB | 0 | 0 | 0 | 00:00:00 |
| TOTAL: 7 | 76 | 36 | 120.4 KB | 18 | 0 | 0 | 00:02:32 | |
NNRP total resource statistics [Top 20]:
| System | User(ms) | System(ms) | Idle(ms) | Elapsed |
|---|---|---|---|---|
| 66.61.98.95 | 0.361 | 0.241 | 0.000 | 00:01:05 |
| 120.150.216.162.bc.googleusercontent.com | 0.161 | 0.021 | 0.000 | 00:00:35 |
| 206.168.34.122 | 0.065 | 0.026 | 0.000 | 00:00:15 |
| azpdwsmq6tyc.stretchoid.com | 0.015 | 0.010 | 0.000 | 00:00:10 |
| 147.185.132.206 | 0.084 | 0.010 | 0.000 | 00:00:08 |
| 147.185.133.4 | 0.042 | 0.004 | 0.000 | 00:00:05 |
| sprightly.monitoring.internet-measurement.com | 0.044 | 0.006 | 0.000 | 00:00:03 |
| joyous.monitoring.internet-measurement.com | 0.039 | 0.006 | 0.000 | 00:00:03 |
| o604.scanner.modat.io | 0.199 | 0.018 | 0.000 | 00:00:01 |
| 198.235.24.85 | 0.006 | 0.006 | 0.000 | 00:00:01 |
| 198.235.24.192 | 0.007 | 0.004 | 0.000 | 00:00:01 |
| o004.scanner.modat.io | 0.199 | 0.019 | 0.000 | 00:00:00 |
| 150.210.203.35.bc.googleusercontent.com | 0.042 | 0.004 | 0.000 | 00:00:00 |
| 172-236-228-222.ip.linodeusercontent.com | 0.017 | 0.005 | 0.000 | 00:00:00 |
| awesome.monitoring.internet-measurement.com | 0.039 | 0.009 | 0.000 | 00:00:00 |
| o012.scanner.modat.io | 0.007 | 0.005 | 0.000 | 00:00:00 |
| faithful.monitoring.internet-measurement.com | 0.040 | 0.005 | 0.000 | 00:00:00 |
| o303.scanner.modat.io | 0.006 | 0.006 | 0.000 | 00:00:00 |
| TOTAL: 18 | 1.373 | 0.405 | 0.000 | 00:02:32 |
Curious NNRP server explorers [Top 20]:
| System | Conn |
|---|---|
| 206.168.34.122 | 5 |
| o004.scanner.modat.io | 5 |
| o604.scanner.modat.io | 5 |
| 120.150.216.162.bc.googleusercontent.com | 4 |
| 147.185.132.206 | 2 |
| 172-236-228-222.ip.linodeusercontent.com | 2 |
| azpdwsmq6tyc.stretchoid.com | 2 |
| 147.185.133.4 | 1 |
| 150.210.203.35.bc.googleusercontent.com | 1 |
| 198.235.24.192 | 1 |
| 198.235.24.85 | 1 |
| awesome.monitoring.internet-measurement.com | 1 |
| exemplary.monitoring.internet-measurement.com | 1 |
| faithful.monitoring.internet-measurement.com | 1 |
| joyous.monitoring.internet-measurement.com | 1 |
| o012.scanner.modat.io | 1 |
| o303.scanner.modat.io | 1 |
| ravishing.monitoring.internet-measurement.com | 1 |
| sprightly.monitoring.internet-measurement.com | 1 |
| uplifting.monitoring.internet-measurement.com | 1 |
| TOTAL: 20 | 38 |
NNRP gethostbyaddr failures [Top 20]:
| System | Conn |
|---|---|
| ? (can't getpeername) | 20 |
| TOTAL: 1 | 20 |
NNRP unrecognized commands (by host) [Top 20]:
| System | Conn |
|---|---|
| 120.150.216.162.bc.googleusercontent.com | 8 |
| 172-236-228-222.ip.linodeusercontent.com | 7 |
| 147.185.132.206 | 4 |
| 147.185.133.4 | 4 |
| 150.210.203.35.bc.googleusercontent.com | 4 |
| 206.168.34.122 | 1 |
| azpdwsmq6tyc.stretchoid.com | 1 |
| o004.scanner.modat.io | 1 |
| o604.scanner.modat.io | 1 |
| TOTAL: 9 | 31 |
NNRP unrecognized commands (by command) [Top 20]:
| Command | Count |
|---|---|
| GET / HTTP/1.1 | 6 |
| Host: 109.238.130.155:563 | 5 |
| Accept: */* | 4 |
| Accept-Encoding: gzip | 3 |
| User-Agent: curl/7.68.0 | 3 |
| HELO | 2 |
| User-Agent: Hello from Palo Alto Network... | 2 |
| #001 | 1 |
| #026#003#001 | 1 |
| EHLO www.censys.io | 1 |
| Host: 109.238.130.155:119 | 1 |
| MGLNDD_109.238.130.155_119 | 1 |
| User-Agent: Mozilla/5.0 (Macintosh; Inte... | 1 |
| TOTAL: 13 | 31 |
NNRP client timeouts [Top 20]:
| System | Conn | Peer |
|---|---|---|
| 120.150.216.162.bc.googleusercontent.com | 2 | 4 |
| 147.185.132.206 | 1 | 2 |
| 147.185.133.4 | 1 | 1 |
| 150.210.203.35.bc.googleusercontent.com | 1 | 1 |
| 206.168.34.122 | 1 | 4 |
| o004.scanner.modat.io | 1 | 1 |
| o604.scanner.modat.io | 1 | 1 |
| TOTAL: 7 | 8 | 17 |
Newsgroup request counts (by hierarchy):
| Hierarchy | Count | Pct | |
|---|---|---|---|
| 1 | rec | 32 | 88.9% |
| 2 | alt | 4 | 11.1% |
| TOTAL: 2 | 36 | 100.0% | |
Newsgroup request counts (by newsgroup) [Top 100]:
| Newsgroup | Count | |
|---|---|---|
| 1 | rec.collecting | 32 |
| 2 | alt.activism.children | 2 |
| 3 | alt.psychology.personality | 2 |
| TOTAL: 3 | 36 | |