Unknown entries from news log file:
First 1 / 1 lines (100.0%)
Log entries by program:
| Program name | Lines | %Lines | Size | %Size |
|---|---|---|---|---|
| inn | 210357 | 71.4% | 28.1 MB | 76.1% |
| innd | 81520 | 27.7% | 8.5 MB | 23.1% |
| innfeed | 2396 | 0.8% | 267.8 KB | 0.7% |
| nnrpd | 178 | 0.1% | 18.1 KB | 0.0% |
| controlchan | 1 | 0.0% | 0.1 KB | 0.0% |
| TOTAL: 5 | 294452 | 100.0% | 36.9 MB | 100.0% |
History cache:
| Reason | Count | %Count |
|---|---|---|
| Do not exist | 210274 | 47.8% |
| Negative hits | 210182 | 47.8% |
| Cache misses | 18192 | 4.1% |
| Positive hits | 1353 | 0.3% |
| TOTAL: 4 | 440001 | 100.0% |
INND timer:
| Code region | Time | Pct | Invoked | Min(ms) | Avg(ms) | Max(ms) |
|---|---|---|---|---|---|---|
| article cancel | 00:00:00.671 | 0.0% | 72 | 0.000 | 9.319 | 74.400 |
| article cleanup | 00:00:00.998 | 0.0% | 210432 | 0.000 | 0.005 | 0.200 |
| article logging | 00:00:03.482 | 0.0% | 210467 | 0.000 | 0.017 | 0.133 |
| article parse | 00:00:02.263 | 0.0% | 652576 | 0.000 | 0.003 | 0.017 |
| article write | 00:04:48.222 | 0.3% | 136084 | 0.000 | 2.118 | 111.000 |
| artlog/artparse | 00:00:00.000 | 0.0% | 0 | 0.000 | 0.000 | 0.000 |
| artlog/artwrite | 00:00:00.000 | 0.0% | 0 | 0.000 | 0.000 | 0.000 |
| data move | 00:00:00.693 | 0.0% | 716510 | 0.000 | 0.001 | 0.056 |
| hisgrep/artcncl | 00:00:00.238 | 0.0% | 72 | 0.000 | 3.306 | 33.000 |
| hishave/artparse | 00:00:00.000 | 0.0% | 0 | 0.000 | 0.000 | 0.000 |
| hissync/artwrite | 00:00:00.000 | 0.0% | 0 | 0.000 | 0.000 | 0.000 |
| history grep | 00:00:00.000 | 0.0% | 0 | 0.000 | 0.000 | 0.000 |
| history lookup | 00:16:33.464 | 1.1% | 440406 | 0.006 | 2.256 | 13.581 |
| history sync | 00:00:00.013 | 0.0% | 308 | 0.000 | 0.042 | 2.000 |
| history write | 00:04:46.647 | 0.3% | 210428 | 0.000 | 1.362 | 7.521 |
| hiswrite/artparse | 00:00:00.000 | 0.0% | 0 | 0.000 | 0.000 | 0.000 |
| idle | 23:28:03.760 | 97.7% | 672524 | 25.760 | 125.622 | 60060.000 |
| nntp read | 00:00:05.380 | 0.0% | 672289 | 0.000 | 0.008 | 0.120 |
| overview write | 00:00:19.405 | 0.0% | 136084 | 0.000 | 0.143 | 6.038 |
| perl filter | 00:05:10.705 | 0.4% | 210428 | 0.341 | 1.477 | 39.000 |
| python filter | 00:00:10.961 | 0.0% | 440402 | 0.000 | 0.025 | 0.375 |
| site send | 00:00:01.136 | 0.0% | 136063 | 0.000 | 0.008 | 0.143 |
| TOTAL: 24:00:43.012 | 24:00:08.038 | 100.0% | - | - | - | - |
INNfeed timer:
| Code region | Time | Pct | Invoked | Min(ms) | Avg(ms) | Max(ms) |
|---|---|---|---|---|---|---|
| article new | 00:00:00.159 | 0.0% | 135961 | 0.000 | 0.001 | 0.250 |
| article prepare | 00:00:00.042 | 0.0% | 540172 | 0.000 | 0.000 | 0.018 |
| article read | 00:00:52.680 | 0.1% | 135043 | 0.000 | 0.390 | 6.159 |
| backlog stats | 00:00:00.159 | 0.0% | 682892 | 0.000 | 0.000 | 0.015 |
| callbacks | 00:00:00.000 | 0.0% | 0 | 0.000 | 0.000 | 0.000 |
| data read | 00:00:02.498 | 0.0% | 406975 | 0.000 | 0.006 | 0.111 |
| data write | 00:00:04.246 | 0.0% | 271087 | 0.000 | 0.016 | 0.500 |
| idle | 23:58:26.957 | 99.9% | 682892 | 35.271 | 126.384 | 30099.500 |
| status file | 00:00:00.091 | 0.0% | 199 | 0.000 | 0.457 | 11.000 |
| TOTAL: 23:59:33.485 | 23:59:26.832 | 100.0% | - | - | - | - |
nnrpd timer:
| Code region | Time | Pct | Invoked | Min(ms) | Avg(ms) | Max(ms) |
|---|---|---|---|---|---|---|
| idle | 00:00:37.430 | 52.6% | 23 | 66.500 | 1627.391 | 10036.000 |
| newnews | 00:00:00.000 | 0.0% | 0 | 0.000 | 0.000 | 0.000 |
| nntpwrite | 00:00:00.002 | 0.0% | 241 | 0.000 | 0.008 | 0.500 |
| TOTAL: 00:01:11.175 | 00:00:37.432 | 52.6% | - | - | - | - |
Control commands to INND:
| Command | Number |
|---|---|
| flush | 2 |
| flushlogs | 2 |
| go | 2 |
| logmode | 2 |
| lowmark | 1 |
| mode | 144 |
| name | 2 |
| pause | 2 |
| paused | 2 |
| reload | 2 |
| reserve | 2 |
| TOTAL: 11 | 163 |
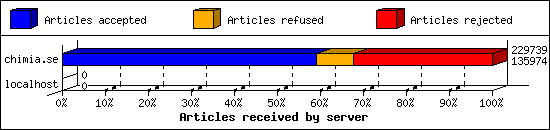
Incoming Feeds (INN):
| Server | Connects | Offered | Taken | Refused | Reject | %Accpt | Elapsed | |
|---|---|---|---|---|---|---|---|---|
| 1 | chimia.se | 1 | 229739 | 135974 | 19539 | 74226 | 59% | 23:54:14 |
| 2 | localhost | 25 | 0 | 0 | 0 | 0 | 0% | 00:00:00 |
| TOTAL: 2 | 26 | 229739 | 135974 | 19539 | 74226 | 59% | 23:54:14 | |
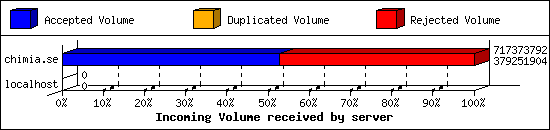
Incoming Volume (INN):
| Server | AcceptVol | DupVol | RejVol | TotalVol | %Acc | Vol/Art | |
|---|---|---|---|---|---|---|---|
| 1 | chimia.se | 361.7 MB | 24.5 KB | 322.4 MB | 684.1 MB | 52% | 3.3 KB |
| 2 | localhost | 0.0 KB | 0.0 KB | 0.0 KB | 0.0 KB | 0% | 0 |
| TOTAL: 2 | 361.7 MB | 24.5 KB | 322.4 MB | 684.1 MB | 52% | 3.3 KB | |
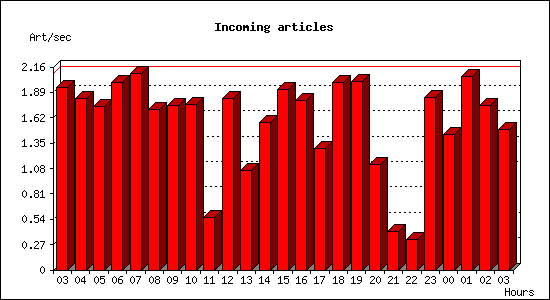
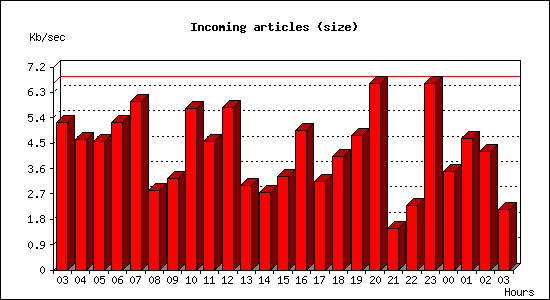
Incoming articles:
| Date | Articles | %Arts | Art/sec | Size | %Size | KB/sec |
|---|---|---|---|---|---|---|
| Jan 2 03:00:01 - 03:59:59 | 7007 | 5.2% | 1.95 | 18.4 MB | 5.1% | 5.22 |
| Jan 2 04:00:00 - 04:59:59 | 6560 | 4.8% | 1.82 | 16.3 MB | 4.5% | 4.64 |
| Jan 2 05:00:00 - 05:59:59 | 6249 | 4.6% | 1.74 | 16.0 MB | 4.4% | 4.55 |
| Jan 2 06:00:00 - 06:59:59 | 7182 | 5.3% | 2.00 | 18.3 MB | 5.1% | 5.22 |
| Jan 2 07:00:00 - 07:59:59 | 7531 | 5.5% | 2.09 | 21.0 MB | 5.8% | 5.98 |
| Jan 2 08:00:00 - 08:59:59 | 6133 | 4.5% | 1.70 | 9.9 MB | 2.7% | 2.82 |
| Jan 2 09:00:00 - 09:59:59 | 6314 | 4.6% | 1.75 | 11.4 MB | 3.1% | 3.23 |
| Jan 2 10:00:00 - 10:59:59 | 6352 | 4.7% | 1.76 | 20.1 MB | 5.6% | 5.73 |
| Jan 2 11:00:00 - 11:59:59 | 1992 | 1.5% | 0.55 | 16.0 MB | 4.4% | 4.56 |
| Jan 2 12:00:00 - 12:59:59 | 6567 | 4.8% | 1.82 | 20.2 MB | 5.6% | 5.75 |
| Jan 2 13:00:00 - 13:59:59 | 3814 | 2.8% | 1.06 | 10.5 MB | 2.9% | 2.99 |
| Jan 2 14:00:00 - 14:59:59 | 5637 | 4.1% | 1.57 | 9.7 MB | 2.7% | 2.76 |
| Jan 2 15:00:00 - 15:59:59 | 6895 | 5.1% | 1.92 | 11.7 MB | 3.2% | 3.32 |
| Jan 2 16:00:00 - 16:59:59 | 6503 | 4.8% | 1.81 | 17.4 MB | 4.8% | 4.95 |
| Jan 2 17:00:00 - 17:59:59 | 4649 | 3.4% | 1.29 | 11.0 MB | 3.0% | 3.14 |
| Jan 2 18:00:00 - 18:59:59 | 7192 | 5.3% | 2.00 | 14.2 MB | 3.9% | 4.03 |
| Jan 2 19:00:00 - 19:59:59 | 7230 | 5.3% | 2.01 | 16.8 MB | 4.6% | 4.77 |
| Jan 2 20:00:00 - 20:59:59 | 4041 | 3.0% | 1.12 | 23.3 MB | 6.4% | 6.62 |
| Jan 2 21:00:00 - 21:59:59 | 1461 | 1.1% | 0.41 | 5.1 MB | 1.4% | 1.46 |
| Jan 2 22:00:00 - 22:59:59 | 1162 | 0.9% | 0.32 | 8.0 MB | 2.2% | 2.28 |
| Jan 2 23:00:00 - 23:59:59 | 6620 | 4.9% | 1.84 | 23.2 MB | 6.4% | 6.60 |
| Jan 3 00:00:00 - 00:59:59 | 5198 | 3.8% | 1.44 | 12.2 MB | 3.4% | 3.48 |
| Jan 3 01:00:00 - 01:59:59 | 7393 | 5.4% | 2.05 | 16.4 MB | 4.5% | 4.67 |
| Jan 3 02:00:00 - 02:59:59 | 6313 | 4.6% | 1.75 | 14.7 MB | 4.1% | 4.19 |
| Jan 3 03:00:00 - 03:00:02 | 3 | 0.0% | 1.50 | 4.3 KB | 0.0% | 2.16 |
| TOTAL: 24:00:01 | 135998 | 100.0% | 1.57 | 361.9 MB | 100.0% | 4.29 |
Sites sending bad articles:
| Server | Total | Group | Dist | Duplic | Unapp | TooOld | Site | Line | Other | |
|---|---|---|---|---|---|---|---|---|---|---|
| 1 | chimia.se | 74359 | 0 | 0 | 4 | 0 | 0 | 0 | 0 | 74355 |
| TOTAL: 1 | 74359 | 0 | 0 | 4 | 0 | 0 | 0 | 0 | 74355 | |
INND Perl filter [Top 20]:
| Reason | Count |
|---|---|
| EMP (phl) | 35302 |
| EMP (phn path) | 24187 |
| EMP (phn nph) | 10848 |
| EMP (md5) | 2329 |
| HTML Multipart | 756 |
| Too many newsgroups (meow) | 288 |
| Too many newsgroups (low_xpost) | 251 |
| HTML post | 109 |
| Scoring filter | 85 |
| MI5 Filter | 66 |
| Subject Rejected | 50 |
| Too many test groups in crosspost | 15 |
| EMP (fsl) | 11 |
| Binary Image: misplaced jpg | 8 |
| hierarchy violation - crosspost outside sdnet | 5 |
| Binary: misplaced binary | 4 |
| Binary Image: misplaced jpeg | 1 |
| Excessive Supersedes (panix2.panix.com) | 1 |
| HTML file attachment | 1 |
| Too many newsgroups | 1 |
| TOTAL: 22 | 74320 |
Miscellaneous innd statistics [Top 10]:
| Event | Server | Number |
|---|---|---|
| Bad Message-ID's offered | ||
| chimia.se | 127 | |
| TOTAL: 1 | 127 | |
| Including strange strings | ||
| chimia.se | 35 | |
| TOTAL: 1 | 35 | |
| TOTAL: 2 | 162 | |
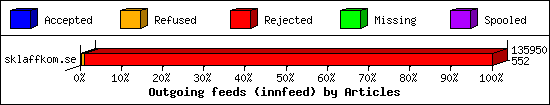
Outgoing Feeds (innfeed) by Articles:
| Server | Offered | Taken | Refused | Reject | Miss | Spool | %Took | Elapsed | |
|---|---|---|---|---|---|---|---|---|---|
| 1 | sklaffkom.se | 135950 | 552 | 891 | 134507 | 0 | 0 | 0% | 23:57:28 |
| 2 | sklaff.dev | 0 | 0 | 0 | 0 | 0 | 135950 | 0% | 23:57:46 |
| 3 | thebunker.nu | 0 | 0 | 0 | 0 | 0 | 135950 | 0% | 23:59:58 |
| 4 | usenet.blueworldhosting.com | 0 | 0 | 0 | 0 | 0 | 35471 | 0% | 23:59:58 |
| TOTAL: 4 | 135950 | 552 | 891 | 134507 | 0 | 307371 | 0% | 95:55:10 | |
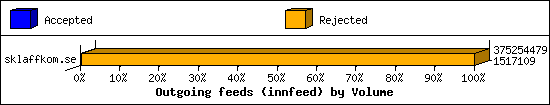
Outgoing Feeds (innfeed) by Volume:
| Server | AcceptVol | RejectVol | TotalVol | Volume/sec | Vol/Art | Elapsed | |
|---|---|---|---|---|---|---|---|
| 1 | sklaffkom.se | 1.4 MB | 356.4 MB | 357.9 MB | 4.2 KB/s | 2.7 KB | 23:57:28 |
| 2 | sklaff.dev | 0.0 KB | 0.0 KB | 0.0 KB | 0.0 KB/s | 0 | 23:57:46 |
| 3 | thebunker.nu | 0.0 KB | 0.0 KB | 0.0 KB | 0.0 KB/s | 0 | 23:59:58 |
| 4 | usenet.blueworldhosting.com | 0.0 KB | 0.0 KB | 0.0 KB | 0.0 KB/s | 0 | 23:59:58 |
| TOTAL: 4 | 1.4 MB | 356.4 MB | 357.9 MB | 1.1 KB/s | 2.7 KB | 95:55:10 | |
NNRP readership statistics:
| System | Conn | Arts | Size | Groups | Post | Rej | Elapsed | |
|---|---|---|---|---|---|---|---|---|
| 1 | o316.scanner.modat.io | 5 | 0 | 0.0 KB | 0 | 0 | 0 | 00:00:00 |
| 2 | scanner-27.ch1.censys-scanner.com | 5 | 0 | 0.0 KB | 0 | 0 | 0 | 00:00:12 |
| 3 | 188.150.216.162.bc.googleusercontent.com | 4 | 0 | 0.0 KB | 0 | 0 | 0 | 00:00:24 |
| 4 | 167.94.146.58 | 3 | 0 | 0.0 KB | 0 | 0 | 0 | 00:00:04 |
| 5 | 31.149.216.162.bc.googleusercontent.com | 2 | 0 | 0.0 KB | 0 | 0 | 0 | 00:00:04 |
| 6 | azpdss6g987c.stretchoid.com | 2 | 0 | 0.0 KB | 0 | 0 | 0 | 00:00:10 |
| 7 | 147.185.132.162 | 1 | 0 | 0.0 KB | 0 | 0 | 0 | 00:00:00 |
| 8 | 147.185.132.47 | 1 | 0 | 0.0 KB | 0 | 0 | 0 | 00:00:00 |
| 9 | 167.94.138.188 | 1 | 0 | 0.0 KB | 0 | 0 | 0 | 00:00:02 |
| 10 | 196.210.203.35.bc.googleusercontent.com | 1 | 0 | 0.0 KB | 0 | 0 | 0 | 00:00:00 |
| 11 | 205.210.31.171 | 1 | 0 | 0.0 KB | 0 | 0 | 0 | 00:00:00 |
| 12 | o009.scanner.modat.io | 1 | 0 | 0.0 KB | 0 | 0 | 0 | 00:00:00 |
| 13 | sh-ams-nl-gp1-wk114c.internet-census.org | 1 | 0 | 0.0 KB | 0 | 0 | 0 | 00:00:10 |
| TOTAL: 13 | 28 | 0 | 0.0 KB | 0 | 0 | 0 | 00:01:11 | |
NNRP readership statistics (by domain):
| System | Conn | Arts | Size | Groups | Post | Rej | Elapsed | |
|---|---|---|---|---|---|---|---|---|
| 1 | unresolved | 7 | 0 | 0.0 KB | 0 | 0 | 0 | 00:00:08 |
| 2 | *.scanner.modat.io | 6 | 0 | 0.0 KB | 0 | 0 | 0 | 00:00:00 |
| 3 | *.ch1.censys-scanner.com | 5 | 0 | 0.0 KB | 0 | 0 | 0 | 00:00:12 |
| 4 | *.150.216.162.bc.googleusercontent.com | 4 | 0 | 0.0 KB | 0 | 0 | 0 | 00:00:24 |
| 5 | *.149.216.162.bc.googleusercontent.com | 2 | 0 | 0.0 KB | 0 | 0 | 0 | 00:00:04 |
| 6 | *.stretchoid.com | 2 | 0 | 0.0 KB | 0 | 0 | 0 | 00:00:10 |
| 7 | *.210.203.35.bc.googleusercontent.com | 1 | 0 | 0.0 KB | 0 | 0 | 0 | 00:00:00 |
| 8 | *.internet-census.org | 1 | 0 | 0.0 KB | 0 | 0 | 0 | 00:00:10 |
| TOTAL: 8 | 28 | 0 | 0.0 KB | 0 | 0 | 0 | 00:01:11 | |
NNRP total resource statistics [Top 20]:
| System | User(ms) | System(ms) | Idle(ms) | Elapsed |
|---|---|---|---|---|
| 188.150.216.162.bc.googleusercontent.com | 0.161 | 0.020 | 0.000 | 00:00:24 |
| scanner-27.ch1.censys-scanner.com | 0.069 | 0.020 | 0.000 | 00:00:12 |
| azpdss6g987c.stretchoid.com | 0.015 | 0.011 | 0.000 | 00:00:10 |
| sh-ams-nl-gp1-wk114c.internet-census.org | 0.008 | 0.006 | 0.000 | 00:00:10 |
| 31.149.216.162.bc.googleusercontent.com | 0.080 | 0.011 | 0.000 | 00:00:04 |
| 167.94.146.58 | 0.052 | 0.019 | 0.000 | 00:00:04 |
| 167.94.138.188 | 0.042 | 0.006 | 0.000 | 00:00:02 |
| 147.185.132.162 | 0.007 | 0.005 | 0.000 | 00:00:00 |
| 205.210.31.171 | 0.007 | 0.004 | 0.000 | 00:00:00 |
| 147.185.132.47 | 0.044 | 0.003 | 0.000 | 00:00:00 |
| o316.scanner.modat.io | 0.195 | 0.029 | 0.000 | 00:00:00 |
| 196.210.203.35.bc.googleusercontent.com | 0.045 | 0.004 | 0.000 | 00:00:00 |
| o009.scanner.modat.io | 0.008 | 0.005 | 0.000 | 00:00:00 |
| TOTAL: 13 | 0.733 | 0.143 | 0.000 | 00:01:11 |
NNRP gethostbyaddr failures [Top 20]:
| System | Conn |
|---|---|
| ? (can't getpeername) | 11 |
| TOTAL: 1 | 11 |
NNRP unrecognized commands (by host) [Top 20]:
| System | Conn |
|---|---|
| 188.150.216.162.bc.googleusercontent.com | 8 |
| 147.185.132.47 | 4 |
| 196.210.203.35.bc.googleusercontent.com | 4 |
| 31.149.216.162.bc.googleusercontent.com | 4 |
| scanner-27.ch1.censys-scanner.com | 4 |
| 167.94.138.188 | 1 |
| 167.94.146.58 | 1 |
| azpdss6g987c.stretchoid.com | 1 |
| o316.scanner.modat.io | 1 |
| TOTAL: 9 | 28 |
NNRP unrecognized commands (by command) [Top 20]:
| Command | Count |
|---|---|
| GET / HTTP/1.1 | 5 |
| Host: 109.238.130.155:563 | 5 |
| Accept: */* | 3 |
| EHLO www.censys.io | 3 |
| User-Agent: curl/7.68.0 | 3 |
| Accept-Encoding: gzip | 2 |
| User-Agent: Hello from Palo Alto Network... | 2 |
| #023#003#023#001#023#002#001 | 1 |
| #026#003#001 | 1 |
| HELO | 1 |
| MGLNDD_109.238.130.155_119 | 1 |
| Òâïg6Cí=&±rOoMûHÁ{#002#027x#006\x7f©V #bïŒ#014þ#011# ØñMµc... | 1 |
| TOTAL: 12 | 28 |
NNRP client timeouts [Top 20]:
| System | Conn | Peer |
|---|---|---|
| 188.150.216.162.bc.googleusercontent.com | 2 | 4 |
| scanner-27.ch1.censys-scanner.com | 2 | 4 |
| 147.185.132.47 | 1 | 1 |
| 167.94.146.58 | 1 | 2 |
| 196.210.203.35.bc.googleusercontent.com | 1 | 1 |
| 31.149.216.162.bc.googleusercontent.com | 1 | 2 |
| o316.scanner.modat.io | 1 | 1 |
| TOTAL: 7 | 9 | 17 |