Unknown entries from news log file:
First 1 / 1 lines (100.0%)
Log entries by program:
| Program name | Lines | %Lines | Size | %Size |
|---|---|---|---|---|
| inn | 197736 | 66.2% | 25.8 MB | 70.5% |
| innd | 98343 | 32.9% | 10.5 MB | 28.7% |
| innfeed | 2427 | 0.8% | 253.1 KB | 0.7% |
| nnrpd | 154 | 0.1% | 15.8 KB | 0.0% |
| controlchan | 1 | 0.0% | 0.1 KB | 0.0% |
| TOTAL: 5 | 298661 | 100.0% | 36.6 MB | 100.0% |
History cache:
| Reason | Count | %Count |
|---|---|---|
| Do not exist | 197671 | 42.7% |
| Negative hits | 197300 | 42.7% |
| Cache misses | 66541 | 14.4% |
| Positive hits | 954 | 0.2% |
| TOTAL: 4 | 462466 | 100.0% |
INND timer:
| Code region | Time | Pct | Invoked | Min(ms) | Avg(ms) | Max(ms) |
|---|---|---|---|---|---|---|
| article cancel | 00:00:00.341 | 0.0% | 563 | 0.000 | 0.606 | 48.333 |
| article cleanup | 00:00:01.063 | 0.0% | 197663 | 0.000 | 0.005 | 0.200 |
| article logging | 00:00:03.394 | 0.0% | 197689 | 0.000 | 0.017 | 0.348 |
| article parse | 00:00:02.284 | 0.0% | 617559 | 0.000 | 0.004 | 0.067 |
| article write | 00:07:58.045 | 0.6% | 106434 | 0.000 | 4.491 | 215.000 |
| artlog/artparse | 00:00:00.000 | 0.0% | 0 | 0.000 | 0.000 | 0.000 |
| artlog/artwrite | 00:00:00.000 | 0.0% | 0 | 0.000 | 0.000 | 0.000 |
| data move | 00:00:00.740 | 0.0% | 734606 | 0.000 | 0.001 | 0.012 |
| hisgrep/artcncl | 00:00:00.105 | 0.0% | 563 | 0.000 | 0.187 | 0.938 |
| hishave/artparse | 00:00:00.000 | 0.0% | 0 | 0.000 | 0.000 | 0.000 |
| hissync/artwrite | 00:00:00.000 | 0.0% | 0 | 0.000 | 0.000 | 0.000 |
| history grep | 00:00:00.000 | 0.0% | 0 | 0.000 | 0.000 | 0.000 |
| history lookup | 00:16:50.122 | 1.2% | 462684 | 0.000 | 2.183 | 11.142 |
| history sync | 00:00:00.003 | 0.0% | 298 | 0.000 | 0.010 | 1.000 |
| history write | 00:04:42.915 | 0.3% | 197521 | 0.000 | 1.432 | 16.333 |
| hiswrite/artparse | 00:00:00.000 | 0.0% | 0 | 0.000 | 0.000 | 0.000 |
| idle | 23:23:24.041 | 97.5% | 685377 | 23.384 | 122.858 | 60060.000 |
| nntp read | 00:00:06.023 | 0.0% | 685171 | 0.000 | 0.009 | 0.107 |
| overview write | 00:00:25.133 | 0.0% | 106434 | 0.000 | 0.236 | 16.000 |
| perl filter | 00:04:46.944 | 0.3% | 197521 | 0.318 | 1.453 | 68.000 |
| python filter | 00:00:13.484 | 0.0% | 462542 | 0.000 | 0.029 | 0.365 |
| site send | 00:00:00.972 | 0.0% | 106434 | 0.000 | 0.009 | 0.167 |
| TOTAL: 23:59:14.216 | 23:58:35.609 | 100.0% | - | - | - | - |
INNfeed timer:
| Code region | Time | Pct | Invoked | Min(ms) | Avg(ms) | Max(ms) |
|---|---|---|---|---|---|---|
| article new | 00:00:00.171 | 0.0% | 106442 | 0.000 | 0.002 | 0.038 |
| article prepare | 00:00:00.036 | 0.0% | 419880 | 0.000 | 0.000 | 0.009 |
| article read | 00:00:32.220 | 0.0% | 104970 | 0.000 | 0.307 | 26.941 |
| backlog stats | 00:00:00.144 | 0.0% | 534166 | 0.000 | 0.000 | 0.333 |
| callbacks | 00:00:00.000 | 0.0% | 0 | 0.000 | 0.000 | 0.000 |
| data read | 00:00:02.133 | 0.0% | 317860 | 0.000 | 0.007 | 0.111 |
| data write | 00:00:03.361 | 0.0% | 211488 | 0.000 | 0.016 | 1.000 |
| idle | 23:58:49.105 | 99.9% | 534166 | 42.270 | 161.615 | 30100.500 |
| status file | 00:00:00.172 | 0.0% | 219 | 0.000 | 0.785 | 26.667 |
| TOTAL: 23:59:33.095 | 23:59:27.342 | 100.0% | - | - | - | - |
nnrpd timer:
| Code region | Time | Pct | Invoked | Min(ms) | Avg(ms) | Max(ms) |
|---|---|---|---|---|---|---|
| idle | 00:00:13.994 | 18.2% | 7 | 0.000 | 1999.143 | 10029.000 |
| newnews | 00:00:00.000 | 0.0% | 0 | 0.000 | 0.000 | 0.000 |
| nntpwrite | 00:00:00.000 | 0.0% | 88 | 0.000 | 0.000 | 0.000 |
| TOTAL: 00:01:16.985 | 00:00:13.994 | 18.2% | - | - | - | - |
Control commands to INND:
| Command | Number |
|---|---|
| flush | 2 |
| flushlogs | 2 |
| go | 2 |
| logmode | 2 |
| lowmark | 1 |
| mode | 144 |
| name | 2 |
| pause | 2 |
| paused | 2 |
| reload | 2 |
| reserve | 2 |
| TOTAL: 11 | 163 |
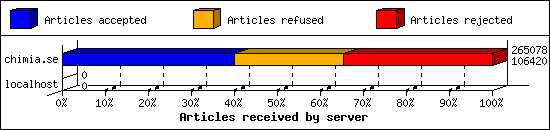
Incoming Feeds (INN):
| Server | Connects | Offered | Taken | Refused | Reject | %Accpt | Elapsed | |
|---|---|---|---|---|---|---|---|---|
| 1 | chimia.se | 1 | 265078 | 106420 | 67356 | 91302 | 40% | 23:54:30 |
| 2 | localhost | 25 | 0 | 0 | 0 | 0 | 0% | 00:00:01 |
| TOTAL: 2 | 26 | 265078 | 106420 | 67356 | 91302 | 40% | 23:54:31 | |
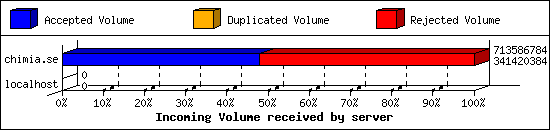
Incoming Volume (INN):
| Server | AcceptVol | DupVol | RejVol | TotalVol | %Acc | Vol/Art | |
|---|---|---|---|---|---|---|---|
| 1 | chimia.se | 325.6 MB | 954.4 KB | 354.0 MB | 680.5 MB | 47% | 3.5 KB |
| 2 | localhost | 0.0 KB | 0.0 KB | 0.0 KB | 0.0 KB | 0% | 0 |
| TOTAL: 2 | 325.6 MB | 954.4 KB | 354.0 MB | 680.5 MB | 47% | 3.5 KB | |
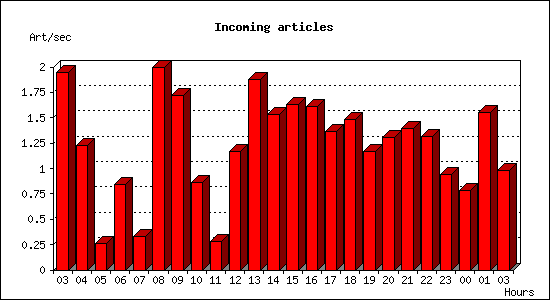
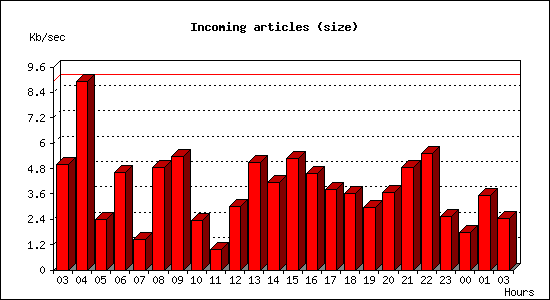
Incoming articles:
| Date | Articles | %Arts | Art/sec | Size | %Size | KB/sec |
|---|---|---|---|---|---|---|
| Jan 3 03:00:02 - 03:59:59 | 6996 | 6.6% | 1.94 | 17.6 MB | 5.4% | 5.00 |
| Jan 3 04:00:00 - 04:59:59 | 4401 | 4.1% | 1.22 | 31.3 MB | 9.6% | 8.92 |
| Jan 3 05:00:00 - 05:59:59 | 939 | 0.9% | 0.26 | 8.3 MB | 2.6% | 2.37 |
| Jan 3 06:00:00 - 06:59:59 | 3031 | 2.8% | 0.84 | 16.2 MB | 5.0% | 4.62 |
| Jan 3 07:00:00 - 07:59:59 | 1180 | 1.1% | 0.33 | 5.0 MB | 1.5% | 1.43 |
| Jan 3 08:00:00 - 08:59:59 | 7182 | 6.7% | 2.00 | 17.0 MB | 5.2% | 4.85 |
| Jan 3 09:00:00 - 09:59:59 | 6180 | 5.8% | 1.72 | 18.9 MB | 5.8% | 5.38 |
| Jan 3 10:00:00 - 10:59:59 | 3093 | 2.9% | 0.86 | 8.2 MB | 2.5% | 2.32 |
| Jan 3 11:00:00 - 11:59:59 | 1011 | 0.9% | 0.28 | 3.5 MB | 1.1% | 0.99 |
| Jan 3 12:00:00 - 12:59:59 | 4208 | 4.0% | 1.17 | 10.5 MB | 3.2% | 2.99 |
| Jan 3 13:00:00 - 13:59:59 | 6773 | 6.4% | 1.88 | 17.9 MB | 5.5% | 5.09 |
| Jan 3 14:00:00 - 14:59:59 | 5528 | 5.2% | 1.54 | 14.6 MB | 4.5% | 4.16 |
| Jan 3 15:00:00 - 15:59:59 | 5885 | 5.5% | 1.63 | 18.6 MB | 5.7% | 5.28 |
| Jan 3 16:00:00 - 16:59:59 | 5813 | 5.5% | 1.61 | 16.0 MB | 4.9% | 4.54 |
| Jan 3 17:00:00 - 17:59:59 | 4918 | 4.6% | 1.37 | 13.3 MB | 4.1% | 3.80 |
| Jan 3 18:00:00 - 18:59:59 | 5322 | 5.0% | 1.48 | 12.6 MB | 3.9% | 3.59 |
| Jan 3 19:00:00 - 19:59:59 | 4186 | 3.9% | 1.16 | 10.4 MB | 3.2% | 2.96 |
| Jan 3 20:00:00 - 20:59:59 | 4716 | 4.4% | 1.31 | 12.8 MB | 3.9% | 3.65 |
| Jan 3 21:00:00 - 21:59:59 | 5035 | 4.7% | 1.40 | 17.1 MB | 5.2% | 4.86 |
| Jan 3 22:00:00 - 22:59:59 | 4723 | 4.4% | 1.31 | 19.4 MB | 5.9% | 5.51 |
| Jan 3 23:00:00 - 23:59:59 | 3393 | 3.2% | 0.94 | 8.9 MB | 2.7% | 2.54 |
| Jan 4 00:00:00 - 00:59:59 | 2828 | 2.7% | 0.79 | 6.2 MB | 1.9% | 1.77 |
| Jan 4 01:00:00 - 01:59:59 | 5602 | 5.3% | 1.56 | 12.5 MB | 3.8% | 3.54 |
| Jan 4 02:00:00 - 03:00:01 | 3516 | 3.3% | 0.98 | 8.6 MB | 2.6% | 2.45 |
| TOTAL: 23:59:59 | 106459 | 100.0% | 1.23 | 325.5 MB | 100.0% | 3.86 |
Sites sending bad articles:
| Server | Total | Group | Dist | Duplic | Unapp | TooOld | Site | Line | Other | |
|---|---|---|---|---|---|---|---|---|---|---|
| 1 | chimia.se | 91277 | 0 | 0 | 142 | 0 | 0 | 0 | 0 | 91135 |
| TOTAL: 1 | 91277 | 0 | 0 | 142 | 0 | 0 | 0 | 0 | 91135 | |
INND Perl filter [Top 20]:
| Reason | Count |
|---|---|
| EMP (phn path) | 36464 |
| EMP (phl) | 29011 |
| EMP (phn nph) | 15348 |
| EMP (md5) | 5201 |
| Too many newsgroups (meow) | 2946 |
| EMP (fsl) | 1304 |
| Too many newsgroups (low_xpost) | 417 |
| HTML Multipart | 158 |
| Binary Image: misplaced jpg | 51 |
| Scoring filter | 49 |
| HTML post | 34 |
| Excessive Supersedes (panix2.panix.com) | 33 |
| MI5 Filter | 24 |
| Subject Rejected | 15 |
| Too many newsgroups | 10 |
| Too many test groups in crosspost | 9 |
| Binary: misplaced binary | 6 |
| Adult group ECP | 5 |
| Binary Image: misplaced gif | 5 |
| EMP (phr path) | 5 |
| TOTAL: 27 | 91109 |
Miscellaneous innd statistics [Top 10]:
| Event | Server | Number |
|---|---|---|
| Bad Message-ID's offered | ||
| chimia.se | 225 | |
| TOTAL: 1 | 225 | |
| Including strange strings | ||
| chimia.se | 26 | |
| TOTAL: 1 | 26 | |
| TOTAL: 2 | 251 | |
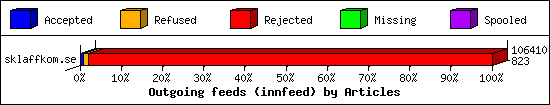
Outgoing Feeds (innfeed) by Articles:
| Server | Offered | Taken | Refused | Reject | Miss | Spool | %Took | Elapsed | |
|---|---|---|---|---|---|---|---|---|---|
| 1 | sklaffkom.se | 106410 | 823 | 1423 | 104164 | 0 | 0 | 0% | 23:17:13 |
| 2 | sklaff.dev | 0 | 0 | 0 | 0 | 0 | 106410 | 0% | 23:57:44 |
| 3 | thebunker.nu | 0 | 0 | 0 | 0 | 0 | 106410 | 0% | 23:59:57 |
| 4 | usenet.blueworldhosting.com | 0 | 0 | 0 | 0 | 0 | 30479 | 0% | 23:59:57 |
| TOTAL: 4 | 106410 | 823 | 1423 | 104164 | 0 | 243299 | 0% | 95:14:51 | |
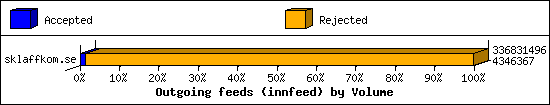
Outgoing Feeds (innfeed) by Volume:
| Server | AcceptVol | RejectVol | TotalVol | Volume/sec | Vol/Art | Elapsed | |
|---|---|---|---|---|---|---|---|
| 1 | sklaffkom.se | 4.1 MB | 317.1 MB | 321.2 MB | 3.9 KB/s | 3.1 KB | 23:17:13 |
| 2 | sklaff.dev | 0.0 KB | 0.0 KB | 0.0 KB | 0.0 KB/s | 0 | 23:57:44 |
| 3 | thebunker.nu | 0.0 KB | 0.0 KB | 0.0 KB | 0.0 KB/s | 0 | 23:59:57 |
| 4 | usenet.blueworldhosting.com | 0.0 KB | 0.0 KB | 0.0 KB | 0.0 KB/s | 0 | 23:59:57 |
| TOTAL: 4 | 4.1 MB | 317.1 MB | 321.2 MB | 1.0 KB/s | 3.1 KB | 95:14:51 | |
NNRP readership statistics:
| System | Conn | Arts | Size | Groups | Post | Rej | Elapsed | |
|---|---|---|---|---|---|---|---|---|
| 1 | o025.scanner.modat.io | 5 | 0 | 0.0 KB | 0 | 0 | 0 | 00:00:00 |
| 2 | 147.185.133.245 | 2 | 0 | 0.0 KB | 0 | 0 | 0 | 00:00:32 |
| 3 | 147.185.133.74 | 2 | 0 | 0.0 KB | 0 | 0 | 0 | 00:00:19 |
| 4 | azpdes04ekbn.stretchoid.com | 2 | 0 | 0.0 KB | 0 | 0 | 0 | 00:00:10 |
| 5 | transcendent.monitoring.internet-measurement.com | 2 | 0 | 0.0 KB | 0 | 0 | 0 | 00:00:03 |
| 6 | 108.210.203.35.bc.googleusercontent.com | 1 | 0 | 0.0 KB | 0 | 0 | 0 | 00:00:00 |
| 7 | 179.211.203.35.bc.googleusercontent.com | 1 | 0 | 0.0 KB | 0 | 0 | 0 | 00:00:00 |
| 8 | 181.211.203.35.bc.googleusercontent.com | 1 | 0 | 0.0 KB | 0 | 0 | 0 | 00:00:00 |
| 9 | 185.169.4.104 | 1 | 0 | 0.0 KB | 0 | 0 | 0 | 00:00:00 |
| 10 | 198.235.24.47 | 1 | 0 | 0.0 KB | 0 | 0 | 0 | 00:00:03 |
| 11 | ec2-54-183-181-0.us-west-1.compute.amazonaws.com | 1 | 0 | 0.0 KB | 0 | 0 | 0 | 00:00:00 |
| 12 | ec2-54-67-90-8.us-west-1.compute.amazonaws.com | 1 | 0 | 0.0 KB | 0 | 0 | 0 | 00:00:00 |
| 13 | energetic.monitoring.internet-measurement.com | 1 | 0 | 0.0 KB | 0 | 0 | 0 | 00:00:00 |
| 14 | fun.monitoring.internet-measurement.com | 1 | 0 | 0.0 KB | 0 | 0 | 0 | 00:00:03 |
| 15 | gutsy.monitoring.internet-measurement.com | 1 | 0 | 0.0 KB | 0 | 0 | 0 | 00:00:00 |
| 16 | nash.probe.onyphe.net | 1 | 0 | 0.0 KB | 0 | 0 | 0 | 00:00:03 |
| 17 | pleasurable.monitoring.internet-measurement.com | 1 | 0 | 0.0 KB | 0 | 0 | 0 | 00:00:00 |
| 18 | upstanding.monitoring.internet-measurement.com | 1 | 0 | 0.0 KB | 0 | 0 | 0 | 00:00:00 |
| TOTAL: 18 | 26 | 0 | 0.0 KB | 0 | 0 | 0 | 00:01:16 | |
NNRP readership statistics (by domain):
| System | Conn | Arts | Size | Groups | Post | Rej | Elapsed | |
|---|---|---|---|---|---|---|---|---|
| 1 | *.monitoring.internet-measurement.com | 7 | 0 | 0.0 KB | 0 | 0 | 0 | 00:00:06 |
| 2 | unresolved | 6 | 0 | 0.0 KB | 0 | 0 | 0 | 00:00:55 |
| 3 | *.scanner.modat.io | 5 | 0 | 0.0 KB | 0 | 0 | 0 | 00:00:00 |
| 4 | *.211.203.35.bc.googleusercontent.com | 2 | 0 | 0.0 KB | 0 | 0 | 0 | 00:00:00 |
| 5 | *.stretchoid.com | 2 | 0 | 0.0 KB | 0 | 0 | 0 | 00:00:10 |
| 6 | *.us-west-1.compute.amazonaws.com | 2 | 0 | 0.0 KB | 0 | 0 | 0 | 00:00:00 |
| 7 | *.210.203.35.bc.googleusercontent.com | 1 | 0 | 0.0 KB | 0 | 0 | 0 | 00:00:00 |
| 8 | *.probe.onyphe.net | 1 | 0 | 0.0 KB | 0 | 0 | 0 | 00:00:03 |
| TOTAL: 8 | 26 | 0 | 0.0 KB | 0 | 0 | 0 | 00:01:16 | |
NNRP total resource statistics [Top 20]:
| System | User(ms) | System(ms) | Idle(ms) | Elapsed |
|---|---|---|---|---|
| 147.185.133.245 | 0.066 | 0.027 | 0.000 | 00:00:32 |
| 147.185.133.74 | 0.082 | 0.007 | 0.000 | 00:00:19 |
| azpdes04ekbn.stretchoid.com | 0.010 | 0.015 | 0.000 | 00:00:10 |
| 198.235.24.47 | 0.009 | 0.005 | 0.000 | 00:00:03 |
| transcendent.monitoring.internet-measurement.com | 0.039 | 0.005 | 0.000 | 00:00:03 |
| fun.monitoring.internet-measurement.com | 0.045 | 0.004 | 0.000 | 00:00:03 |
| nash.probe.onyphe.net | 0.042 | 0.003 | 0.000 | 00:00:03 |
| o025.scanner.modat.io | 0.206 | 0.022 | 0.000 | 00:00:00 |
| ec2-54-183-181-0.us-west-1.compute.amazonaws.com | 0.043 | 0.010 | 0.000 | 00:00:00 |
| 181.211.203.35.bc.googleusercontent.com | 0.040 | 0.008 | 0.000 | 00:00:00 |
| 179.211.203.35.bc.googleusercontent.com | 0.041 | 0.005 | 0.000 | 00:00:00 |
| 108.210.203.35.bc.googleusercontent.com | 0.005 | 0.006 | 0.000 | 00:00:00 |
| 185.169.4.104 | 0.037 | 0.009 | 0.000 | 00:00:00 |
| pleasurable.monitoring.internet-measurement.com | 0.040 | 0.003 | 0.000 | 00:00:00 |
| ec2-54-67-90-8.us-west-1.compute.amazonaws.com | 0.007 | 0.006 | 0.000 | 00:00:00 |
| TOTAL: 15 | 0.712 | 0.135 | 0.000 | 00:01:16 |
NNRP gethostbyaddr failures [Top 20]:
| System | Conn |
|---|---|
| ? (can't getpeername) | 14 |
| TOTAL: 1 | 14 |
NNRP unrecognized commands (by host) [Top 20]:
| System | Conn |
|---|---|
| 108.210.203.35.bc.googleusercontent.com | 4 |
| 147.185.133.245 | 4 |
| 147.185.133.74 | 4 |
| 179.211.203.35.bc.googleusercontent.com | 4 |
| 181.211.203.35.bc.googleusercontent.com | 4 |
| azpdes04ekbn.stretchoid.com | 1 |
| o025.scanner.modat.io | 1 |
| TOTAL: 7 | 22 |
NNRP unrecognized commands (by command) [Top 20]:
| Command | Count |
|---|---|
| GET / HTTP/1.1 | 5 |
| Host: 109.238.130.155:563 | 4 |
| Accept-Encoding: gzip | 3 |
| User-Agent: Hello from Palo Alto Network... | 3 |
| Accept: */* | 2 |
| User-Agent: curl/7.68.0 | 2 |
| HELO | 1 |
| Host: 109.238.130.155:119 | 1 |
| MGLNDD_109.238.130.155_119 | 1 |
| TOTAL: 9 | 22 |
NNRP client timeouts [Top 20]:
| System | Conn | Peer |
|---|---|---|
| 147.185.133.245 | 1 | 2 |
| 147.185.133.74 | 1 | 2 |
| 179.211.203.35.bc.googleusercontent.com | 1 | 1 |
| 181.211.203.35.bc.googleusercontent.com | 1 | 1 |
| o025.scanner.modat.io | 1 | 1 |
| TOTAL: 5 | 5 | 10 |