Unknown entries from news log file:
First 1 / 1 lines (100.0%)
Log entries by program:
| Program name | Lines | %Lines | Size | %Size |
|---|---|---|---|---|
| inn | 242120 | 66.9% | 34.0 MB | 72.8% |
| innd | 117087 | 32.4% | 12.4 MB | 26.6% |
| innfeed | 2409 | 0.7% | 266.6 KB | 0.6% |
| nnrpd | 162 | 0.0% | 15.9 KB | 0.0% |
| controlchan | 1 | 0.0% | 0.1 KB | 0.0% |
| TOTAL: 5 | 361779 | 100.0% | 46.6 MB | 100.0% |
History cache:
| Reason | Count | %Count |
|---|---|---|
| Do not exist | 241731 | 49.5% |
| Negative hits | 238276 | 48.8% |
| Cache misses | 7837 | 1.6% |
| Positive hits | 840 | 0.2% |
| TOTAL: 4 | 488684 | 100.0% |
INND timer:
| Code region | Time | Pct | Invoked | Min(ms) | Avg(ms) | Max(ms) |
|---|---|---|---|---|---|---|
| article cancel | 00:00:00.091 | 0.0% | 447 | 0.000 | 0.204 | 1.071 |
| article cleanup | 00:00:01.080 | 0.0% | 241919 | 0.000 | 0.004 | 0.121 |
| article logging | 00:00:03.881 | 0.0% | 242047 | 0.000 | 0.016 | 0.200 |
| article parse | 00:00:02.310 | 0.0% | 729756 | 0.000 | 0.003 | 0.056 |
| article write | 00:02:35.289 | 0.2% | 133579 | 0.000 | 1.163 | 52.000 |
| artlog/artparse | 00:00:00.000 | 0.0% | 0 | 0.000 | 0.000 | 0.000 |
| artlog/artwrite | 00:00:00.000 | 0.0% | 0 | 0.000 | 0.000 | 0.000 |
| data move | 00:00:00.310 | 0.0% | 757817 | 0.000 | 0.000 | 0.023 |
| hisgrep/artcncl | 00:00:00.032 | 0.0% | 447 | 0.000 | 0.072 | 1.036 |
| hishave/artparse | 00:00:00.000 | 0.0% | 0 | 0.000 | 0.000 | 0.000 |
| hissync/artwrite | 00:00:00.000 | 0.0% | 0 | 0.000 | 0.000 | 0.000 |
| history grep | 00:00:00.000 | 0.0% | 0 | 0.000 | 0.000 | 0.000 |
| history lookup | 00:09:14.623 | 0.6% | 489189 | 0.000 | 1.134 | 10.903 |
| history sync | 00:00:00.006 | 0.0% | 313 | 0.000 | 0.019 | 1.000 |
| history write | 00:04:57.465 | 0.3% | 241907 | 0.000 | 1.230 | 7.266 |
| hiswrite/artparse | 00:00:00.000 | 0.0% | 0 | 0.000 | 0.000 | 0.000 |
| idle | 23:36:14.362 | 98.4% | 738933 | 33.742 | 114.996 | 60015.000 |
| nntp read | 00:00:06.338 | 0.0% | 738710 | 0.000 | 0.009 | 0.156 |
| overview write | 00:00:33.177 | 0.0% | 133579 | 0.000 | 0.248 | 5.558 |
| perl filter | 00:04:59.088 | 0.3% | 241907 | 0.385 | 1.236 | 78.000 |
| python filter | 00:00:12.976 | 0.0% | 488877 | 0.000 | 0.027 | 0.358 |
| site send | 00:00:01.186 | 0.0% | 133579 | 0.000 | 0.009 | 0.080 |
| TOTAL: 23:59:37.528 | 23:59:02.214 | 100.0% | - | - | - | - |
INNfeed timer:
| Code region | Time | Pct | Invoked | Min(ms) | Avg(ms) | Max(ms) |
|---|---|---|---|---|---|---|
| article new | 00:00:00.199 | 0.0% | 133570 | 0.000 | 0.001 | 0.038 |
| article prepare | 00:00:00.028 | 0.0% | 513352 | 0.000 | 0.000 | 0.004 |
| article read | 00:00:10.878 | 0.0% | 128338 | 0.000 | 0.085 | 8.500 |
| backlog stats | 00:00:00.156 | 0.0% | 655121 | 0.000 | 0.000 | 0.005 |
| callbacks | 00:00:00.000 | 0.0% | 0 | 0.000 | 0.000 | 0.000 |
| data read | 00:00:02.490 | 0.0% | 391898 | 0.000 | 0.006 | 0.034 |
| data write | 00:00:04.046 | 0.0% | 258391 | 0.000 | 0.016 | 0.074 |
| idle | 23:59:14.925 | 100.0% | 655121 | 35.103 | 131.815 | 30073.500 |
| status file | 00:00:00.155 | 0.0% | 199 | 0.000 | 0.779 | 36.000 |
| TOTAL: 23:59:39.301 | 23:59:32.877 | 100.0% | - | - | - | - |
nnrpd timer:
| Code region | Time | Pct | Invoked | Min(ms) | Avg(ms) | Max(ms) |
|---|---|---|---|---|---|---|
| idle | 00:00:25.084 | 48.6% | 36 | 32.000 | 696.778 | 10008.000 |
| newnews | 00:00:00.000 | 0.0% | 0 | 0.000 | 0.000 | 0.000 |
| nntpwrite | 00:00:00.002 | 0.0% | 163 | 0.000 | 0.012 | 0.250 |
| readart | 00:00:00.017 | 0.0% | 2 | 8.500 | 8.500 | 8.500 |
| TOTAL: 00:00:51.666 | 00:00:25.103 | 48.6% | - | - | - | - |
Control commands to INND:
| Command | Number |
|---|---|
| flush | 2 |
| flushlogs | 2 |
| go | 2 |
| logmode | 2 |
| lowmark | 1 |
| mode | 146 |
| name | 2 |
| pause | 2 |
| paused | 2 |
| reload | 2 |
| reserve | 2 |
| TOTAL: 11 | 165 |
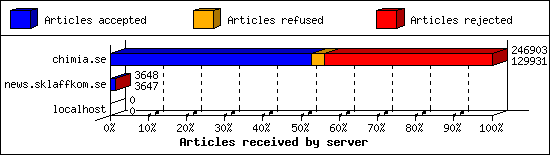
Incoming Feeds (INN):
| Server | Connects | Offered | Taken | Refused | Reject | %Accpt | Elapsed | |
|---|---|---|---|---|---|---|---|---|
| 1 | chimia.se | 2 | 246903 | 129931 | 8665 | 108307 | 52% | 23:52:52 |
| 2 | news.sklaffkom.se | 2 | 3648 | 3647 | 0 | 1 | 99% | 24:12:53 |
| 3 | localhost | 25 | 0 | 0 | 0 | 0 | 0% | 00:00:00 |
| TOTAL: 3 | 29 | 250551 | 133578 | 8665 | 108308 | 53% | 48:05:45 | |
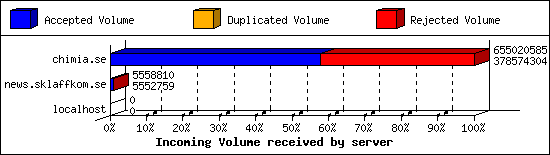
Incoming Volume (INN):
| Server | AcceptVol | DupVol | RejVol | TotalVol | %Acc | Vol/Art | |
|---|---|---|---|---|---|---|---|
| 1 | chimia.se | 361.0 MB | 69.0 KB | 263.6 MB | 624.7 MB | 57% | 2.7 KB |
| 2 | news.sklaffkom.se | 5.3 MB | 0.0 KB | 5.9 KB | 5.3 MB | 99% | 1.5 KB |
| 3 | localhost | 0.0 KB | 0.0 KB | 0.0 KB | 0.0 KB | 0% | 0 |
| TOTAL: 3 | 366.3 MB | 69.0 KB | 263.6 MB | 630.0 MB | 58% | 2.7 KB | |
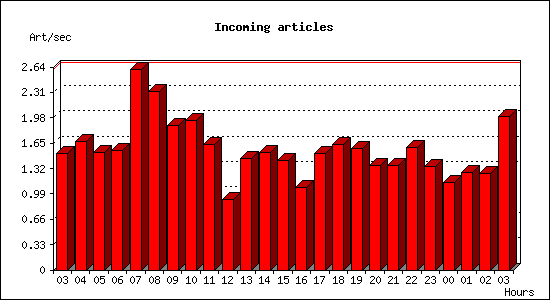
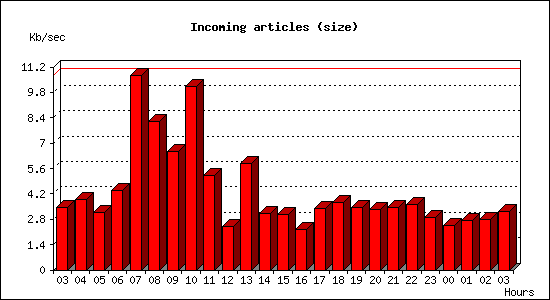
Incoming articles:
| Date | Articles | %Arts | Art/sec | Size | %Size | KB/sec |
|---|---|---|---|---|---|---|
| Jan 7 03:00:02 - 03:59:59 | 5460 | 4.1% | 1.52 | 12.1 MB | 3.3% | 3.44 |
| Jan 7 04:00:00 - 04:59:59 | 6032 | 4.5% | 1.68 | 13.7 MB | 3.7% | 3.90 |
| Jan 7 05:00:00 - 05:59:59 | 5520 | 4.1% | 1.53 | 11.1 MB | 3.0% | 3.16 |
| Jan 7 06:00:00 - 06:59:59 | 5609 | 4.2% | 1.56 | 15.5 MB | 4.2% | 4.40 |
| Jan 7 07:00:00 - 07:59:59 | 9392 | 7.0% | 2.61 | 37.8 MB | 10.3% | 10.74 |
| Jan 7 08:00:00 - 08:59:59 | 8338 | 6.2% | 2.32 | 28.8 MB | 7.8% | 8.18 |
| Jan 7 09:00:00 - 09:59:59 | 6772 | 5.1% | 1.88 | 22.9 MB | 6.2% | 6.51 |
| Jan 7 10:00:00 - 10:59:59 | 6986 | 5.2% | 1.94 | 35.5 MB | 9.7% | 10.10 |
| Jan 7 11:00:00 - 11:59:59 | 5860 | 4.4% | 1.63 | 18.4 MB | 5.0% | 5.23 |
| Jan 7 12:00:00 - 12:59:59 | 3290 | 2.5% | 0.91 | 8.5 MB | 2.3% | 2.41 |
| Jan 7 13:00:00 - 13:59:59 | 5240 | 3.9% | 1.46 | 20.7 MB | 5.6% | 5.89 |
| Jan 7 14:00:00 - 14:59:59 | 5513 | 4.1% | 1.53 | 11.1 MB | 3.0% | 3.14 |
| Jan 7 15:00:00 - 15:59:59 | 5141 | 3.8% | 1.43 | 10.7 MB | 2.9% | 3.05 |
| Jan 7 16:00:00 - 16:59:59 | 3847 | 2.9% | 1.07 | 7.9 MB | 2.2% | 2.26 |
| Jan 7 17:00:00 - 17:59:59 | 5471 | 4.1% | 1.52 | 11.9 MB | 3.2% | 3.38 |
| Jan 7 18:00:00 - 18:59:59 | 5859 | 4.4% | 1.63 | 13.0 MB | 3.6% | 3.71 |
| Jan 7 19:00:00 - 19:59:59 | 5679 | 4.3% | 1.58 | 12.2 MB | 3.3% | 3.47 |
| Jan 7 20:00:00 - 20:59:59 | 4877 | 3.7% | 1.35 | 11.8 MB | 3.2% | 3.34 |
| Jan 7 21:00:00 - 21:59:59 | 4902 | 3.7% | 1.36 | 12.1 MB | 3.3% | 3.44 |
| Jan 7 22:00:00 - 22:59:59 | 5752 | 4.3% | 1.60 | 12.7 MB | 3.5% | 3.62 |
| Jan 7 23:00:00 - 23:59:59 | 4855 | 3.6% | 1.35 | 10.2 MB | 2.8% | 2.89 |
| Jan 8 00:00:00 - 00:59:59 | 4116 | 3.1% | 1.14 | 8.7 MB | 2.4% | 2.47 |
| Jan 8 01:00:00 - 01:59:59 | 4578 | 3.4% | 1.27 | 9.7 MB | 2.6% | 2.76 |
| Jan 8 02:00:00 - 02:59:59 | 4505 | 3.4% | 1.25 | 9.7 MB | 2.6% | 2.76 |
| Jan 8 03:00:00 - 03:00:01 | 2 | 0.0% | 2.00 | 3.2 KB | 0.0% | 3.23 |
| TOTAL: 23:59:59 | 133596 | 100.0% | 1.55 | 366.5 MB | 100.0% | 4.34 |
Sites sending bad articles:
| Server | Total | Group | Dist | Duplic | Unapp | TooOld | Site | Line | Other | |
|---|---|---|---|---|---|---|---|---|---|---|
| 1 | chimia.se | 108523 | 0 | 0 | 12 | 7 | 0 | 0 | 0 | 108504 |
| 2 | news.sklaffkom.se | 1 | 0 | 0 | 0 | 0 | 0 | 0 | 0 | 1 |
| TOTAL: 2 | 108524 | 0 | 0 | 12 | 7 | 0 | 0 | 0 | 108505 | |
Supposedly-moderated groups with unmoderated postings [Top 20]:
| Groups | Count |
|---|---|
| news.answers | 6 |
| news.newusers.questions | 1 |
| TOTAL: 2 | 7 |
INND Perl filter [Top 20]:
| Reason | Count |
|---|---|
| EMP (phn path) | 62312 |
| EMP (phn nph) | 26878 |
| EMP (phl) | 16120 |
| EMP (md5) | 1302 |
| Too many newsgroups (meow) | 988 |
| Subject Rejected | 201 |
| HTML Multipart | 175 |
| Too many test groups in crosspost | 122 |
| MI5 Filter | 74 |
| Too many newsgroups | 63 |
| Too many newsgroups (low_xpost) | 45 |
| EMP (fsl) | 38 |
| Scoring filter | 36 |
| HTML post | 9 |
| Binary Image: misplaced gif | 7 |
| Binary: misplaced binary | 4 |
| Binary Image: misplaced jpg | 1 |
| HTML file attachment | 1 |
| PFM bot misc | 1 |
| TOTAL: 19 | 108377 |
Miscellaneous innd statistics [Top 10]:
| Event | Server | Number |
|---|---|---|
| Bad Message-ID's offered | ||
| chimia.se | 37 | |
| TOTAL: 1 | 37 | |
| Including strange strings | ||
| chimia.se | 128 | |
| TOTAL: 1 | 128 | |
| TOTAL: 2 | 165 | |
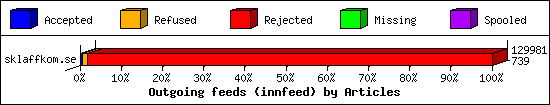
Outgoing Feeds (innfeed) by Articles:
| Server | Offered | Taken | Refused | Reject | Miss | Spool | %Took | Elapsed | |
|---|---|---|---|---|---|---|---|---|---|
| 1 | sklaffkom.se | 129981 | 739 | 1618 | 127624 | 0 | 0 | 0% | 23:59:57 |
| 2 | sklaff.dev | 0 | 0 | 0 | 0 | 0 | 133594 | 0% | 23:57:44 |
| 3 | thebunker.nu | 0 | 0 | 0 | 0 | 0 | 133594 | 0% | 23:59:57 |
| 4 | usenet.blueworldhosting.com | 0 | 0 | 0 | 0 | 0 | 132995 | 0% | 23:59:57 |
| TOTAL: 4 | 129981 | 739 | 1618 | 127624 | 0 | 400183 | 0% | 95:57:35 | |
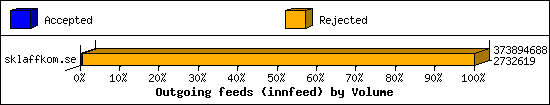
Outgoing Feeds (innfeed) by Volume:
| Server | AcceptVol | RejectVol | TotalVol | Volume/sec | Vol/Art | Elapsed | |
|---|---|---|---|---|---|---|---|
| 1 | sklaffkom.se | 2.6 MB | 354.0 MB | 356.6 MB | 4.2 KB/s | 2.8 KB | 23:59:57 |
| 2 | sklaff.dev | 0.0 KB | 0.0 KB | 0.0 KB | 0.0 KB/s | 0 | 23:57:44 |
| 3 | thebunker.nu | 0.0 KB | 0.0 KB | 0.0 KB | 0.0 KB/s | 0 | 23:59:57 |
| 4 | usenet.blueworldhosting.com | 0.0 KB | 0.0 KB | 0.0 KB | 0.0 KB/s | 0 | 23:59:57 |
| TOTAL: 4 | 2.6 MB | 354.0 MB | 356.6 MB | 1.1 KB/s | 2.8 KB | 95:57:35 | |
NNRP readership statistics:
| System | Conn | Arts | Size | Groups | Post | Rej | Elapsed | |
|---|---|---|---|---|---|---|---|---|
| 1 | 66.61.98.95 | 4 | 2 | 9.7 KB | 1 | 0 | 0 | 00:00:06 |
| TOTAL: 1 | 4 | 2 | 9.7 KB | 1 | 0 | 0 | 00:00:51 | |
NNRP readership statistics (by domain):
| System | Conn | Arts | Size | Groups | Post | Rej | Elapsed | |
|---|---|---|---|---|---|---|---|---|
| 1 | unresolved | 11 | 2 | 9.7 KB | 1 | 0 | 0 | 00:00:34 |
| 2 | *.scanner.modat.io | 6 | 0 | 0.0 KB | 0 | 0 | 0 | 00:00:00 |
| 3 | *.149.216.162.bc.googleusercontent.com | 2 | 0 | 0.0 KB | 0 | 0 | 0 | 00:00:01 |
| 4 | *.probe.onyphe.net | 2 | 0 | 0.0 KB | 0 | 0 | 0 | 00:00:03 |
| 5 | *.stretchoid.com | 2 | 0 | 0.0 KB | 0 | 0 | 0 | 00:00:10 |
| 6 | *.monitoring.internet-measurement.com | 1 | 0 | 0.0 KB | 0 | 0 | 0 | 00:00:01 |
| TOTAL: 6 | 24 | 2 | 9.7 KB | 1 | 0 | 0 | 00:00:51 | |
NNRP total resource statistics [Top 20]:
| System | User(ms) | System(ms) | Idle(ms) | Elapsed |
|---|---|---|---|---|
| 147.185.133.213 | 0.079 | 0.010 | 0.000 | 00:00:21 |
| azpdwssa099m.stretchoid.com | 0.011 | 0.013 | 0.000 | 00:00:10 |
| 66.61.98.95 | 0.044 | 0.024 | 0.000 | 00:00:06 |
| nash.probe.onyphe.net | 0.009 | 0.002 | 0.000 | 00:00:02 |
| 205.210.31.86 | 0.006 | 0.008 | 0.000 | 00:00:02 |
| robust.monitoring.internet-measurement.com | 0.006 | 0.006 | 0.000 | 00:00:01 |
| 12.149.216.162.bc.googleusercontent.com | 0.078 | 0.012 | 0.000 | 00:00:01 |
| 206.168.34.114 | 0.038 | 0.012 | 0.000 | 00:00:01 |
| 205.210.31.145 | 0.006 | 0.005 | 0.000 | 00:00:01 |
| 147.185.132.146 | 0.043 | 0.003 | 0.000 | 00:00:00 |
| foley.probe.onyphe.net | 0.007 | 0.011 | 0.000 | 00:00:00 |
| o302.scanner.modat.io | 0.207 | 0.024 | 0.000 | 00:00:00 |
| 147.185.133.93 | 0.040 | 0.005 | 0.000 | 00:00:00 |
| o303.scanner.modat.io | 0.005 | 0.008 | 0.000 | 00:00:00 |
| TOTAL: 14 | 0.579 | 0.143 | 0.000 | 00:00:51 |
Curious NNRP server explorers [Top 20]:
| System | Conn |
|---|---|
| o302.scanner.modat.io | 5 |
| 12.149.216.162.bc.googleusercontent.com | 2 |
| 147.185.133.213 | 2 |
| azpdwssa099m.stretchoid.com | 2 |
| 147.185.132.146 | 1 |
| 147.185.133.93 | 1 |
| 205.210.31.145 | 1 |
| 205.210.31.86 | 1 |
| 206.168.34.114 | 1 |
| foley.probe.onyphe.net | 1 |
| nash.probe.onyphe.net | 1 |
| o303.scanner.modat.io | 1 |
| robust.monitoring.internet-measurement.com | 1 |
| TOTAL: 13 | 20 |
NNRP gethostbyaddr failures [Top 20]:
| System | Conn |
|---|---|
| ? (can't getpeername) | 9 |
| TOTAL: 1 | 9 |
NNRP unrecognized commands (by host) [Top 20]:
| System | Conn |
|---|---|
| 12.149.216.162.bc.googleusercontent.com | 4 |
| 147.185.132.146 | 4 |
| 147.185.133.213 | 4 |
| 147.185.133.93 | 4 |
| foley.probe.onyphe.net | 3 |
| 206.168.34.114 | 1 |
| azpdwssa099m.stretchoid.com | 1 |
| o302.scanner.modat.io | 1 |
| TOTAL: 8 | 22 |
NNRP unrecognized commands (by command) [Top 20]:
| Command | Count |
|---|---|
| GET / HTTP/1.1 | 4 |
| Host: 109.238.130.155:563 | 4 |
| Accept-Encoding: gzip | 2 |
| Accept: */* | 2 |
| User-Agent: Hello from Palo Alto Network... | 2 |
| User-Agent: curl/7.68.0 | 2 |
| #026#003#003#001¨#001 | 1 |
| 1):×›#037¿KF#020^ûÔC2"ƒ#013s’-oCÑßµí | 1 |
| EHLO www.censys.io | 1 |
| HELO | 1 |
| MGLNDD_109.238.130.155_119 | 1 |
| À$ÀÀ¯À,ÀrÀsÌ©#023#002#023#001Ì#024À#007À#022À#023À'À/À#024À(À0À`Àa... | 1 |
| TOTAL: 12 | 22 |
NNRP client timeouts [Top 20]:
| System | Conn | Peer |
|---|---|---|
| 12.149.216.162.bc.googleusercontent.com | 1 | 2 |
| 147.185.132.146 | 1 | 1 |
| 147.185.133.213 | 1 | 2 |
| 147.185.133.93 | 1 | 1 |
| o302.scanner.modat.io | 1 | 1 |
| TOTAL: 5 | 5 | 9 |
Newsgroup request counts (by hierarchy):
| Hierarchy | Count | Pct | |
|---|---|---|---|
| 1 | alt | 2 | 100.0% |
| TOTAL: 1 | 2 | 100.0% | |
Newsgroup request counts (by newsgroup) [Top 100]:
| Newsgroup | Count | |
|---|---|---|
| 1 | alt.aliens.they-are-here | 2 |
| TOTAL: 1 | 2 | |