Unknown entries from news log file:
First 1 / 1 lines (100.0%)
Log entries by program:
| Program name | Lines | %Lines | Size | %Size |
|---|---|---|---|---|
| inn | 242137 | 71.4% | 33.5 MB | 76.3% |
| innd | 94567 | 27.9% | 10.2 MB | 23.1% |
| innfeed | 2410 | 0.7% | 254.4 KB | 0.6% |
| nnrpd | 180 | 0.1% | 18.7 KB | 0.0% |
| controlchan | 1 | 0.0% | 0.1 KB | 0.0% |
| TOTAL: 5 | 339295 | 100.0% | 43.9 MB | 100.0% |
History cache:
| Reason | Count | %Count |
|---|---|---|
| Do not exist | 242060 | 49.7% |
| Negative hits | 238741 | 49.0% |
| Cache misses | 5401 | 1.1% |
| Positive hits | 1221 | 0.3% |
| TOTAL: 4 | 487423 | 100.0% |
INND timer:
| Code region | Time | Pct | Invoked | Min(ms) | Avg(ms) | Max(ms) |
|---|---|---|---|---|---|---|
| article cancel | 00:00:00.127 | 0.0% | 56 | 0.000 | 2.268 | 30.667 |
| article cleanup | 00:00:01.076 | 0.0% | 242186 | 0.000 | 0.004 | 0.118 |
| article logging | 00:00:03.912 | 0.0% | 242198 | 0.000 | 0.016 | 0.072 |
| article parse | 00:00:02.276 | 0.0% | 728252 | 0.000 | 0.003 | 0.015 |
| article write | 00:02:53.619 | 0.2% | 156298 | 0.000 | 1.111 | 51.000 |
| artlog/artparse | 00:00:00.000 | 0.0% | 1 | 0.000 | 0.000 | 0.000 |
| artlog/artwrite | 00:00:00.000 | 0.0% | 0 | 0.000 | 0.000 | 0.000 |
| data move | 00:00:00.296 | 0.0% | 749715 | 0.000 | 0.000 | 0.017 |
| hisgrep/artcncl | 00:00:00.002 | 0.0% | 56 | 0.000 | 0.036 | 2.000 |
| hishave/artparse | 00:00:00.000 | 0.0% | 1 | 0.000 | 0.000 | 0.000 |
| hissync/artwrite | 00:00:00.000 | 0.0% | 0 | 0.000 | 0.000 | 0.000 |
| history grep | 00:00:00.000 | 0.0% | 0 | 0.000 | 0.000 | 0.000 |
| history lookup | 00:11:31.869 | 0.8% | 487815 | 0.000 | 1.418 | 9.568 |
| history sync | 00:00:00.006 | 0.0% | 303 | 0.000 | 0.020 | 1.000 |
| history write | 00:05:11.107 | 0.4% | 242164 | 0.000 | 1.285 | 7.803 |
| hiswrite/artparse | 00:00:00.000 | 0.0% | 1 | 0.000 | 0.000 | 0.000 |
| idle | 23:33:49.702 | 98.2% | 735376 | 22.969 | 115.356 | 60060.000 |
| nntp read | 00:00:06.339 | 0.0% | 735170 | 0.000 | 0.009 | 0.310 |
| overview write | 00:00:30.070 | 0.0% | 156298 | 0.000 | 0.192 | 8.400 |
| perl filter | 00:05:18.528 | 0.4% | 242164 | 0.341 | 1.315 | 170.000 |
| python filter | 00:00:13.882 | 0.0% | 487492 | 0.000 | 0.028 | 1.000 |
| site send | 00:00:01.273 | 0.0% | 156298 | 0.000 | 0.008 | 0.091 |
| TOTAL: 24:00:19.845 | 23:59:44.084 | 100.0% | - | - | - | - |
INNfeed timer:
| Code region | Time | Pct | Invoked | Min(ms) | Avg(ms) | Max(ms) |
|---|---|---|---|---|---|---|
| article new | 00:00:00.247 | 0.0% | 156108 | 0.000 | 0.002 | 0.034 |
| article prepare | 00:00:00.035 | 0.0% | 605368 | 0.000 | 0.000 | 0.007 |
| article read | 00:00:13.328 | 0.0% | 151342 | 0.000 | 0.088 | 1.978 |
| backlog stats | 00:00:00.205 | 0.0% | 768919 | 0.000 | 0.000 | 0.007 |
| callbacks | 00:00:00.000 | 0.0% | 0 | 0.000 | 0.000 | 0.000 |
| data read | 00:00:02.938 | 0.0% | 460068 | 0.000 | 0.006 | 0.167 |
| data write | 00:00:04.731 | 0.0% | 304023 | 0.000 | 0.016 | 0.054 |
| idle | 23:58:31.648 | 100.0% | 768919 | 36.095 | 112.251 | 30072.500 |
| status file | 00:00:00.148 | 0.0% | 205 | 0.000 | 0.722 | 50.000 |
| TOTAL: 23:59:00.648 | 23:58:53.280 | 100.0% | - | - | - | - |
nnrpd timer:
| Code region | Time | Pct | Invoked | Min(ms) | Avg(ms) | Max(ms) |
|---|---|---|---|---|---|---|
| idle | 00:00:27.730 | 43.8% | 21 | 5.500 | 1320.476 | 10050.000 |
| newnews | 00:00:00.000 | 0.0% | 0 | 0.000 | 0.000 | 0.000 |
| nntpwrite | 00:00:00.903 | 1.4% | 174 | 0.000 | 5.190 | 31.138 |
| readart | 00:00:00.007 | 0.0% | 2 | 3.500 | 3.500 | 3.500 |
| TOTAL: 00:01:03.285 | 00:00:28.640 | 45.3% | - | - | - | - |
Control commands to INND:
| Command | Number |
|---|---|
| flush | 2 |
| flushlogs | 2 |
| go | 2 |
| logmode | 2 |
| lowmark | 1 |
| mode | 146 |
| name | 2 |
| pause | 2 |
| paused | 2 |
| reload | 2 |
| reserve | 2 |
| TOTAL: 11 | 165 |
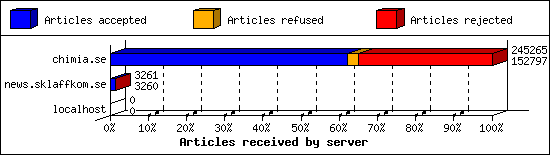
Incoming Feeds (INN):
| Server | Connects | Offered | Taken | Refused | Reject | %Accpt | Elapsed | |
|---|---|---|---|---|---|---|---|---|
| 1 | chimia.se | 2 | 245265 | 152797 | 6599 | 85869 | 62% | 23:54:49 |
| 2 | news.sklaffkom.se | 2 | 3261 | 3260 | 0 | 1 | 99% | 22:32:06 |
| 3 | localhost | 25 | 0 | 0 | 0 | 0 | 0% | 00:00:00 |
| TOTAL: 3 | 29 | 248526 | 156057 | 6599 | 85870 | 62% | 46:26:55 | |
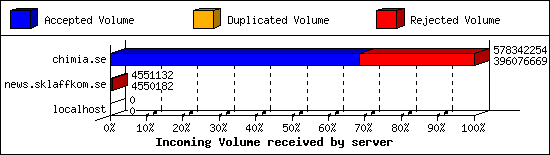
Incoming Volume (INN):
| Server | AcceptVol | DupVol | RejVol | TotalVol | %Acc | Vol/Art | |
|---|---|---|---|---|---|---|---|
| 1 | chimia.se | 377.7 MB | 135.9 KB | 173.7 MB | 551.6 MB | 68% | 2.4 KB |
| 2 | news.sklaffkom.se | 4.3 MB | 0.0 KB | 0.9 KB | 4.3 MB | 99% | 1.4 KB |
| 3 | localhost | 0.0 KB | 0.0 KB | 0.0 KB | 0.0 KB | 0% | 0 |
| TOTAL: 3 | 382.1 MB | 135.9 KB | 173.7 MB | 555.9 MB | 68% | 2.4 KB | |
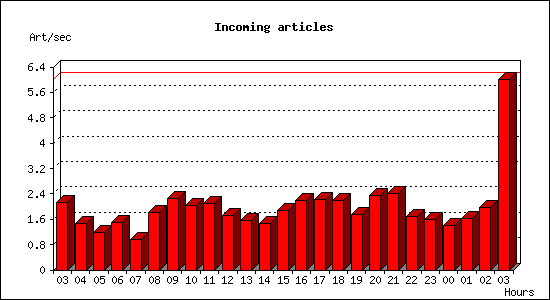
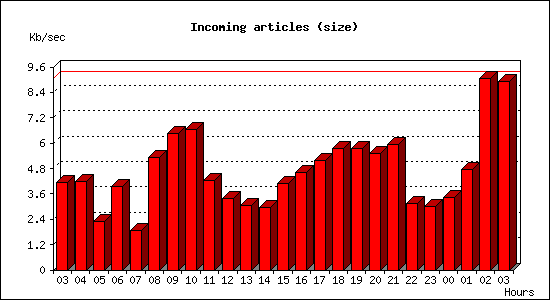
Incoming articles:
| Date | Articles | %Arts | Art/sec | Size | %Size | KB/sec |
|---|---|---|---|---|---|---|
| Jan 9 03:00:02 - 03:59:59 | 7618 | 4.9% | 2.12 | 14.6 MB | 3.8% | 4.14 |
| Jan 9 04:00:00 - 04:59:59 | 5315 | 3.4% | 1.48 | 14.6 MB | 3.8% | 4.17 |
| Jan 9 05:00:00 - 05:59:59 | 4247 | 2.7% | 1.18 | 8.0 MB | 2.1% | 2.28 |
| Jan 9 06:00:00 - 06:59:59 | 5368 | 3.4% | 1.49 | 13.9 MB | 3.6% | 3.96 |
| Jan 9 07:00:00 - 07:59:59 | 3417 | 2.2% | 0.95 | 6.6 MB | 1.7% | 1.89 |
| Jan 9 08:00:00 - 08:59:59 | 6530 | 4.2% | 1.81 | 18.8 MB | 4.9% | 5.34 |
| Jan 9 09:00:00 - 09:59:59 | 8087 | 5.2% | 2.25 | 22.7 MB | 5.9% | 6.45 |
| Jan 9 10:00:00 - 10:59:59 | 7314 | 4.7% | 2.03 | 23.4 MB | 6.1% | 6.65 |
| Jan 9 11:00:00 - 11:59:59 | 7500 | 4.8% | 2.08 | 14.8 MB | 3.9% | 4.21 |
| Jan 9 12:00:00 - 12:59:59 | 6149 | 3.9% | 1.71 | 11.9 MB | 3.1% | 3.38 |
| Jan 9 13:00:00 - 13:59:59 | 5565 | 3.6% | 1.55 | 10.8 MB | 2.8% | 3.06 |
| Jan 9 14:00:00 - 14:59:59 | 5331 | 3.4% | 1.48 | 10.4 MB | 2.7% | 2.96 |
| Jan 9 15:00:00 - 15:59:59 | 6782 | 4.3% | 1.88 | 14.3 MB | 3.7% | 4.07 |
| Jan 9 16:00:00 - 16:59:59 | 7850 | 5.0% | 2.18 | 16.1 MB | 4.2% | 4.59 |
| Jan 9 17:00:00 - 17:59:59 | 8004 | 5.1% | 2.22 | 18.2 MB | 4.8% | 5.18 |
| Jan 9 18:00:00 - 18:59:59 | 7850 | 5.0% | 2.18 | 20.2 MB | 5.3% | 5.75 |
| Jan 9 19:00:00 - 19:59:59 | 6352 | 4.1% | 1.76 | 20.3 MB | 5.3% | 5.76 |
| Jan 9 20:00:00 - 20:59:59 | 8420 | 5.4% | 2.34 | 19.4 MB | 5.1% | 5.52 |
| Jan 9 21:00:00 - 21:59:59 | 8648 | 5.5% | 2.40 | 20.9 MB | 5.5% | 5.94 |
| Jan 9 22:00:00 - 22:59:59 | 6050 | 3.9% | 1.68 | 11.1 MB | 2.9% | 3.16 |
| Jan 9 23:00:00 - 23:59:59 | 5788 | 3.7% | 1.61 | 10.6 MB | 2.8% | 3.01 |
| Jan 10 00:00:00 - 00:59:59 | 5080 | 3.3% | 1.41 | 12.0 MB | 3.1% | 3.42 |
| Jan 10 01:00:00 - 01:59:59 | 5880 | 3.8% | 1.63 | 16.8 MB | 4.4% | 4.77 |
| Jan 10 02:00:00 - 02:59:59 | 7098 | 4.5% | 1.97 | 31.8 MB | 8.3% | 9.06 |
| Jan 10 03:00:00 - 03:00:02 | 12 | 0.0% | 6.00 | 17.9 KB | 0.0% | 8.93 |
| TOTAL: 24:00:00 | 156255 | 100.0% | 1.81 | 382.3 MB | 100.0% | 4.53 |
Sites sending bad articles:
| Server | Total | Group | Dist | Duplic | Unapp | TooOld | Site | Line | Other | |
|---|---|---|---|---|---|---|---|---|---|---|
| 1 | chimia.se | 85881 | 0 | 0 | 22 | 0 | 0 | 0 | 0 | 85859 |
| 2 | news.sklaffkom.se | 1 | 0 | 0 | 0 | 0 | 0 | 0 | 0 | 1 |
| TOTAL: 2 | 85882 | 0 | 0 | 22 | 0 | 0 | 0 | 0 | 85860 | |
INND Perl filter [Top 20]:
| Reason | Count |
|---|---|
| EMP (phn path) | 50326 |
| EMP (phn nph) | 20016 |
| EMP (phl) | 10117 |
| EMP (phr path) | 3453 |
| EMP (md5) | 847 |
| Subject Rejected | 316 |
| HTML Multipart | 292 |
| Too many newsgroups (meow) | 167 |
| MI5 Filter | 98 |
| Too many newsgroups | 67 |
| Too many newsgroups (low_xpost) | 51 |
| HTML post | 30 |
| Scoring filter | 26 |
| Excessive Supersedes (xenon.stanford.edu) | 8 |
| Binary: misplaced binary | 6 |
| HTML file attachment | 6 |
| HTML Image Tags | 5 |
| Binary Image: misplaced gif | 4 |
| PFM bot misc | 3 |
| hierarchy violation - crosspost outside sdnet | 2 |
| TOTAL: 27 | 85847 |
Miscellaneous innd statistics [Top 10]:
| Event | Server | Number |
|---|---|---|
| Bad Message-ID's offered | ||
| chimia.se | 40 | |
| TOTAL: 1 | 40 | |
| Huge articles | ||
| chimia.se | 1 | |
| TOTAL: 1 | 1 | |
| Including strange strings | ||
| chimia.se | 12 | |
| TOTAL: 1 | 12 | |
| TOTAL: 3 | 53 | |
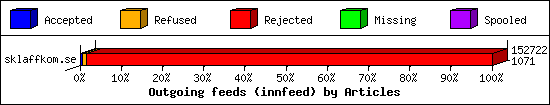
Outgoing Feeds (innfeed) by Articles:
| Server | Offered | Taken | Refused | Reject | Miss | Spool | %Took | Elapsed | |
|---|---|---|---|---|---|---|---|---|---|
| 1 | sklaffkom.se | 152722 | 1071 | 1239 | 150412 | 0 | 0 | 0% | 23:52:36 |
| 2 | sklaff.dev | 0 | 0 | 0 | 0 | 0 | 156180 | 0% | 23:57:43 |
| 3 | thebunker.nu | 0 | 0 | 0 | 0 | 0 | 156180 | 0% | 23:59:58 |
| 4 | usenet.blueworldhosting.com | 0 | 0 | 0 | 0 | 0 | 63613 | 0% | 23:59:57 |
| TOTAL: 4 | 152722 | 1071 | 1239 | 150412 | 0 | 375973 | 0% | 95:50:14 | |
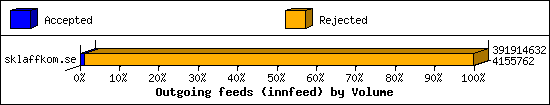
Outgoing Feeds (innfeed) by Volume:
| Server | AcceptVol | RejectVol | TotalVol | Volume/sec | Vol/Art | Elapsed | |
|---|---|---|---|---|---|---|---|
| 1 | sklaffkom.se | 4.0 MB | 369.8 MB | 373.8 MB | 4.5 KB/s | 2.5 KB | 23:52:36 |
| 2 | sklaff.dev | 0.0 KB | 0.0 KB | 0.0 KB | 0.0 KB/s | 0 | 23:57:43 |
| 3 | thebunker.nu | 0.0 KB | 0.0 KB | 0.0 KB | 0.0 KB/s | 0 | 23:59:58 |
| 4 | usenet.blueworldhosting.com | 0.0 KB | 0.0 KB | 0.0 KB | 0.0 KB/s | 0 | 23:59:57 |
| TOTAL: 4 | 4.0 MB | 369.8 MB | 373.8 MB | 1.1 KB/s | 2.5 KB | 95:50:14 | |
NNRP readership statistics:
| System | Conn | Arts | Size | Groups | Post | Rej | Elapsed | |
|---|---|---|---|---|---|---|---|---|
| 1 | 66.61.98.95 | 2 | 2 | 3.7 KB | 1 | 0 | 0 | 00:00:13 |
| TOTAL: 1 | 2 | 2 | 3.7 KB | 1 | 0 | 0 | 00:01:03 | |
NNRP readership statistics (by domain):
| System | Conn | Arts | Size | Groups | Post | Rej | Elapsed | |
|---|---|---|---|---|---|---|---|---|
| 1 | unresolved | 6 | 2 | 3.7 KB | 1 | 0 | 0 | 00:00:21 |
| 2 | *.monitoring.internet-measurement.com | 6 | 0 | 0.0 KB | 0 | 0 | 0 | 00:00:06 |
| 3 | *.scanner.modat.io | 6 | 0 | 0.0 KB | 0 | 0 | 0 | 00:00:00 |
| 4 | *.ch1.censys-scanner.com | 3 | 0 | 0.0 KB | 0 | 0 | 0 | 00:00:04 |
| 5 | *.149.216.162.bc.googleusercontent.com | 2 | 0 | 0.0 KB | 0 | 0 | 0 | 00:00:15 |
| 6 | *.150.216.162.bc.googleusercontent.com | 2 | 0 | 0.0 KB | 0 | 0 | 0 | 00:00:01 |
| 7 | *.stretchoid.com | 2 | 0 | 0.0 KB | 0 | 0 | 0 | 00:00:10 |
| 8 | *.210.203.35.bc.googleusercontent.com | 1 | 0 | 0.0 KB | 0 | 0 | 0 | 00:00:00 |
| 9 | *.probe.onyphe.net | 1 | 0 | 0.0 KB | 0 | 0 | 0 | 00:00:02 |
| TOTAL: 9 | 29 | 2 | 3.7 KB | 1 | 0 | 0 | 00:01:03 | |
NNRP total resource statistics [Top 20]:
| System | User(ms) | System(ms) | Idle(ms) | Elapsed |
|---|---|---|---|---|
| 103.149.216.162.bc.googleusercontent.com | 0.084 | 0.007 | 0.000 | 00:00:15 |
| 66.61.98.95 | 0.050 | 0.109 | 0.000 | 00:00:13 |
| azpdcs1ofkc2.stretchoid.com | 0.012 | 0.010 | 0.000 | 00:00:10 |
| modest.monitoring.internet-measurement.com | 0.075 | 0.018 | 0.000 | 00:00:05 |
| 147.185.133.253 | 0.009 | 0.007 | 0.000 | 00:00:05 |
| scanner-207.ch1.censys-scanner.com | 0.054 | 0.016 | 0.000 | 00:00:04 |
| oscar.probe.onyphe.net | 0.041 | 0.007 | 0.000 | 00:00:02 |
| 205.210.31.150 | 0.008 | 0.004 | 0.000 | 00:00:02 |
| 120.150.216.162.bc.googleusercontent.com | 0.082 | 0.010 | 0.000 | 00:00:01 |
| o309.scanner.modat.io | 0.205 | 0.031 | 0.000 | 00:00:00 |
| 25.210.203.35.bc.googleusercontent.com | 0.044 | 0.004 | 0.000 | 00:00:00 |
| 147.185.132.59 | 0.040 | 0.004 | 0.000 | 00:00:00 |
| treasured.monitoring.internet-measurement.com | 0.077 | 0.010 | 0.000 | 00:00:00 |
| 205.210.31.65 | 0.007 | 0.005 | 0.000 | 00:00:00 |
| renowned.monitoring.internet-measurement.com | 0.039 | 0.005 | 0.000 | 00:00:00 |
| TOTAL: 15 | 0.827 | 0.247 | 0.000 | 00:01:03 |
Curious NNRP server explorers [Top 20]:
| System | Conn |
|---|---|
| o309.scanner.modat.io | 6 |
| scanner-207.ch1.censys-scanner.com | 3 |
| 103.149.216.162.bc.googleusercontent.com | 2 |
| 120.150.216.162.bc.googleusercontent.com | 2 |
| azpdcs1ofkc2.stretchoid.com | 2 |
| modest.monitoring.internet-measurement.com | 2 |
| treasured.monitoring.internet-measurement.com | 2 |
| 147.185.132.59 | 1 |
| 147.185.133.253 | 1 |
| 205.210.31.150 | 1 |
| 205.210.31.65 | 1 |
| 25.210.203.35.bc.googleusercontent.com | 1 |
| oscar.probe.onyphe.net | 1 |
| regal.monitoring.internet-measurement.com | 1 |
| renowned.monitoring.internet-measurement.com | 1 |
| TOTAL: 15 | 27 |
NNRP gethostbyaddr failures [Top 20]:
| System | Conn |
|---|---|
| ? (can't getpeername) | 16 |
| TOTAL: 1 | 16 |
NNRP unrecognized commands (by host) [Top 20]:
| System | Conn |
|---|---|
| 103.149.216.162.bc.googleusercontent.com | 4 |
| 120.150.216.162.bc.googleusercontent.com | 4 |
| 147.185.132.59 | 4 |
| 147.185.133.253 | 4 |
| 25.210.203.35.bc.googleusercontent.com | 4 |
| azpdcs1ofkc2.stretchoid.com | 1 |
| o309.scanner.modat.io | 1 |
| scanner-207.ch1.censys-scanner.com | 1 |
| TOTAL: 8 | 23 |
NNRP unrecognized commands (by command) [Top 20]:
| Command | Count |
|---|---|
| GET / HTTP/1.1 | 5 |
| Host: 109.238.130.155:563 | 4 |
| Accept-Encoding: gzip | 3 |
| User-Agent: Hello from Palo Alto Network... | 3 |
| Accept: */* | 2 |
| User-Agent: curl/7.68.0 | 2 |
| EHLO www.censys.io | 1 |
| HELO | 1 |
| Host: 109.238.130.155:119 | 1 |
| MGLNDD_109.238.130.155_119 | 1 |
| TOTAL: 10 | 23 |
NNRP client timeouts [Top 20]:
| System | Conn | Peer |
|---|---|---|
| 103.149.216.162.bc.googleusercontent.com | 1 | 2 |
| 120.150.216.162.bc.googleusercontent.com | 1 | 2 |
| 147.185.132.59 | 1 | 1 |
| 25.210.203.35.bc.googleusercontent.com | 1 | 1 |
| o309.scanner.modat.io | 1 | 1 |
| scanner-207.ch1.censys-scanner.com | 1 | 2 |
| TOTAL: 6 | 6 | 13 |
Newsgroup request counts (by hierarchy):
| Hierarchy | Count | Pct | |
|---|---|---|---|
| 1 | rec | 2 | 100.0% |
| TOTAL: 1 | 2 | 100.0% | |
Newsgroup request counts (by newsgroup) [Top 100]:
| Newsgroup | Count | |
|---|---|---|
| 1 | rec.skiing.resorts.europe | 2 |
| TOTAL: 1 | 2 | |