Unknown entries from news log file:
First 1 / 1 lines (100.0%)
Log entries by program:
| Program name | Lines | %Lines | Size | %Size |
|---|---|---|---|---|
| inn | 256967 | 73.1% | 34.7 MB | 77.2% |
| innd | 91992 | 26.2% | 10.0 MB | 22.2% |
| innfeed | 2420 | 0.7% | 261.4 KB | 0.6% |
| nnrpd | 218 | 0.1% | 22.1 KB | 0.0% |
| controlchan | 1 | 0.0% | 0.1 KB | 0.0% |
| TOTAL: 5 | 351598 | 100.0% | 44.9 MB | 100.0% |
History cache:
| Reason | Count | %Count |
|---|---|---|
| Do not exist | 256801 | 50.3% |
| Negative hits | 253463 | 49.7% |
| Cache misses | 81 | 0.0% |
| Positive hits | 18 | 0.0% |
| TOTAL: 4 | 510363 | 100.0% |
INND timer:
| Code region | Time | Pct | Invoked | Min(ms) | Avg(ms) | Max(ms) |
|---|---|---|---|---|---|---|
| article cancel | 00:00:00.021 | 0.0% | 14 | 0.000 | 1.500 | 12.000 |
| article cleanup | 00:00:01.354 | 0.0% | 256816 | 0.000 | 0.005 | 0.160 |
| article logging | 00:00:04.327 | 0.0% | 256819 | 0.000 | 0.017 | 0.275 |
| article parse | 00:00:02.364 | 0.0% | 769626 | 0.000 | 0.003 | 0.015 |
| article write | 00:02:21.119 | 0.2% | 173610 | 0.000 | 0.813 | 51.000 |
| artlog/artparse | 00:00:00.000 | 0.0% | 0 | 0.000 | 0.000 | 0.000 |
| artlog/artwrite | 00:00:00.000 | 0.0% | 0 | 0.000 | 0.000 | 0.000 |
| data move | 00:00:00.406 | 0.0% | 782083 | 0.000 | 0.001 | 0.104 |
| hisgrep/artcncl | 00:00:00.012 | 0.0% | 14 | 0.000 | 0.857 | 12.000 |
| hishave/artparse | 00:00:00.000 | 0.0% | 0 | 0.000 | 0.000 | 0.000 |
| hissync/artwrite | 00:00:00.000 | 0.0% | 0 | 0.000 | 0.000 | 0.000 |
| history grep | 00:00:00.000 | 0.0% | 0 | 0.000 | 0.000 | 0.000 |
| history lookup | 00:13:56.927 | 1.0% | 510414 | 0.000 | 1.640 | 8.851 |
| history sync | 00:00:00.017 | 0.0% | 301 | 0.000 | 0.056 | 13.000 |
| history write | 00:05:40.349 | 0.4% | 256816 | 0.000 | 1.325 | 8.000 |
| hiswrite/artparse | 00:00:00.000 | 0.0% | 0 | 0.000 | 0.000 | 0.000 |
| idle | 23:30:26.416 | 98.0% | 770083 | 78.272 | 109.893 | 60059.000 |
| nntp read | 00:00:06.790 | 0.0% | 769905 | 0.000 | 0.009 | 0.500 |
| overview write | 00:00:14.727 | 0.0% | 173610 | 0.000 | 0.085 | 9.000 |
| perl filter | 00:05:25.659 | 0.4% | 256816 | 0.355 | 1.268 | 70.000 |
| python filter | 00:00:15.115 | 0.0% | 510114 | 0.000 | 0.030 | 0.389 |
| site send | 00:00:01.585 | 0.0% | 173610 | 0.000 | 0.009 | 0.054 |
| TOTAL: 23:59:13.608 | 23:58:37.188 | 100.0% | - | - | - | - |
INNfeed timer:
| Code region | Time | Pct | Invoked | Min(ms) | Avg(ms) | Max(ms) |
|---|---|---|---|---|---|---|
| article new | 00:00:00.221 | 0.0% | 173705 | 0.000 | 0.001 | 0.091 |
| article prepare | 00:00:00.055 | 0.0% | 680264 | 0.000 | 0.000 | 0.004 |
| article read | 00:00:17.723 | 0.0% | 170066 | 0.000 | 0.104 | 1.496 |
| backlog stats | 00:00:00.212 | 0.0% | 858978 | 0.000 | 0.000 | 0.004 |
| callbacks | 00:00:00.000 | 0.0% | 0 | 0.000 | 0.000 | 0.000 |
| data read | 00:00:03.343 | 0.0% | 513897 | 0.000 | 0.007 | 0.021 |
| data write | 00:00:05.188 | 0.0% | 340251 | 0.000 | 0.015 | 0.049 |
| idle | 23:59:15.527 | 100.0% | 858978 | 68.098 | 100.533 | 20736.333 |
| status file | 00:00:00.068 | 0.0% | 200 | 0.000 | 0.340 | 4.500 |
| TOTAL: 23:59:50.243 | 23:59:42.337 | 100.0% | - | - | - | - |
nnrpd timer:
| Code region | Time | Pct | Invoked | Min(ms) | Avg(ms) | Max(ms) |
|---|---|---|---|---|---|---|
| idle | 00:18:17.916 | 92.3% | 59 | 0.000 | 18608.746 | 93755.000 |
| newnews | 00:00:00.000 | 0.0% | 0 | 0.000 | 0.000 | 0.000 |
| nntpwrite | 00:00:07.030 | 0.6% | 308 | 0.000 | 22.825 | 168.949 |
| readart | 00:00:00.043 | 0.0% | 4 | 7.000 | 10.750 | 14.500 |
| TOTAL: 00:19:49.546 | 00:18:24.989 | 92.9% | - | - | - | - |
Control commands to INND:
| Command | Number |
|---|---|
| flush | 2 |
| flushlogs | 2 |
| go | 2 |
| logmode | 2 |
| lowmark | 1 |
| mode | 146 |
| name | 2 |
| pause | 2 |
| paused | 2 |
| reload | 2 |
| reserve | 2 |
| TOTAL: 11 | 165 |
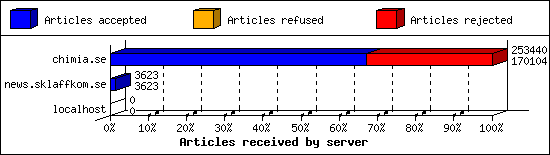
Incoming Feeds (INN):
| Server | Connects | Offered | Taken | Refused | Reject | %Accpt | Elapsed | |
|---|---|---|---|---|---|---|---|---|
| 1 | chimia.se | 2 | 253440 | 170104 | 99 | 83237 | 67% | 23:50:54 |
| 2 | news.sklaffkom.se | 2 | 3623 | 3623 | 0 | 0 | 100% | 23:59:19 |
| 3 | localhost | 25 | 0 | 0 | 0 | 0 | 0% | 00:00:00 |
| TOTAL: 3 | 29 | 257063 | 173727 | 99 | 83237 | 67% | 47:50:13 | |
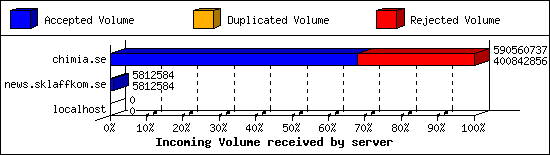
Incoming Volume (INN):
| Server | AcceptVol | DupVol | RejVol | TotalVol | %Acc | Vol/Art | |
|---|---|---|---|---|---|---|---|
| 1 | chimia.se | 382.3 MB | 0.0 KB | 180.9 MB | 563.2 MB | 67% | 2.3 KB |
| 2 | news.sklaffkom.se | 5.5 MB | 0.0 KB | 0.0 KB | 5.5 MB | 100% | 1.6 KB |
| 3 | localhost | 0.0 KB | 0.0 KB | 0.0 KB | 0.0 KB | 0% | 0 |
| TOTAL: 3 | 387.8 MB | 0.0 KB | 180.9 MB | 568.7 MB | 68% | 2.3 KB | |
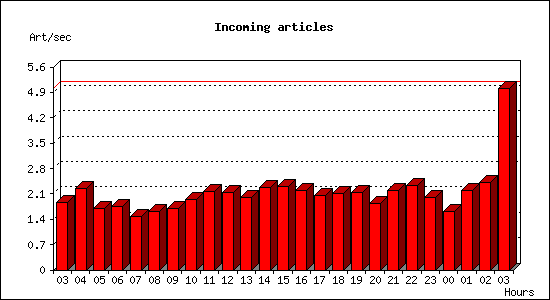
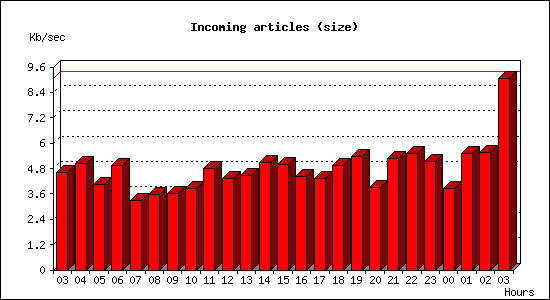
Incoming articles:
| Date | Articles | %Arts | Art/sec | Size | %Size | KB/sec |
|---|---|---|---|---|---|---|
| Jan 12 03:00:01 - 03:59:59 | 6729 | 3.9% | 1.87 | 16.2 MB | 4.2% | 4.60 |
| Jan 12 04:00:00 - 04:59:59 | 8094 | 4.7% | 2.25 | 17.7 MB | 4.6% | 5.03 |
| Jan 12 05:00:00 - 05:59:59 | 6127 | 3.5% | 1.70 | 14.2 MB | 3.7% | 4.04 |
| Jan 12 06:00:00 - 06:59:59 | 6355 | 3.7% | 1.77 | 17.4 MB | 4.5% | 4.94 |
| Jan 12 07:00:00 - 07:59:59 | 5265 | 3.0% | 1.46 | 11.5 MB | 3.0% | 3.28 |
| Jan 12 08:00:00 - 08:59:59 | 5802 | 3.3% | 1.61 | 12.5 MB | 3.2% | 3.55 |
| Jan 12 09:00:00 - 09:59:59 | 6157 | 3.5% | 1.71 | 12.7 MB | 3.3% | 3.61 |
| Jan 12 10:00:00 - 10:59:59 | 6980 | 4.0% | 1.94 | 13.6 MB | 3.5% | 3.88 |
| Jan 12 11:00:00 - 11:59:59 | 7757 | 4.5% | 2.15 | 16.9 MB | 4.3% | 4.80 |
| Jan 12 12:00:00 - 12:59:59 | 7691 | 4.4% | 2.14 | 15.3 MB | 3.9% | 4.34 |
| Jan 12 13:00:00 - 13:59:59 | 7230 | 4.2% | 2.01 | 15.6 MB | 4.0% | 4.45 |
| Jan 12 14:00:00 - 14:59:59 | 8201 | 4.7% | 2.28 | 17.9 MB | 4.6% | 5.10 |
| Jan 12 15:00:00 - 15:59:59 | 8304 | 4.8% | 2.31 | 17.5 MB | 4.5% | 4.97 |
| Jan 12 16:00:00 - 16:59:59 | 7886 | 4.5% | 2.19 | 15.5 MB | 4.0% | 4.41 |
| Jan 12 17:00:00 - 17:59:59 | 7435 | 4.3% | 2.07 | 15.3 MB | 3.9% | 4.35 |
| Jan 12 18:00:00 - 18:59:59 | 7641 | 4.4% | 2.12 | 17.3 MB | 4.5% | 4.92 |
| Jan 12 19:00:00 - 19:59:59 | 7679 | 4.4% | 2.13 | 18.9 MB | 4.9% | 5.38 |
| Jan 12 20:00:00 - 20:59:59 | 6639 | 3.8% | 1.84 | 13.7 MB | 3.5% | 3.88 |
| Jan 12 21:00:00 - 21:59:59 | 7887 | 4.5% | 2.19 | 18.5 MB | 4.8% | 5.27 |
| Jan 12 22:00:00 - 22:59:59 | 8357 | 4.8% | 2.32 | 19.3 MB | 5.0% | 5.50 |
| Jan 12 23:00:00 - 23:59:59 | 7153 | 4.1% | 1.99 | 18.0 MB | 4.7% | 5.13 |
| Jan 13 00:00:00 - 00:59:59 | 5794 | 3.3% | 1.61 | 13.6 MB | 3.5% | 3.86 |
| Jan 13 01:00:00 - 01:59:59 | 7847 | 4.5% | 2.18 | 19.3 MB | 5.0% | 5.49 |
| Jan 13 02:00:00 - 02:59:59 | 8707 | 5.0% | 2.42 | 19.5 MB | 5.0% | 5.54 |
| Jan 13 03:00:00 - 03:00:02 | 10 | 0.0% | 5.00 | 18.1 KB | 0.0% | 9.05 |
| TOTAL: 24:00:01 | 173727 | 100.0% | 2.01 | 387.8 MB | 100.0% | 4.60 |
Sites sending bad articles:
| Server | Total | Group | Dist | Duplic | Unapp | TooOld | Site | Line | Other | |
|---|---|---|---|---|---|---|---|---|---|---|
| 1 | chimia.se | 83240 | 0 | 0 | 0 | 0 | 0 | 0 | 0 | 83240 |
| TOTAL: 1 | 83240 | 0 | 0 | 0 | 0 | 0 | 0 | 0 | 83240 | |
INND Perl filter [Top 20]:
| Reason | Count |
|---|---|
| EMP (phn path) | 48972 |
| EMP (phn nph) | 26274 |
| EMP (phl) | 7404 |
| EMP (md5) | 492 |
| HTML Multipart | 70 |
| Subject Rejected | 18 |
| Binary: misplaced binary | 2 |
| MI5 Filter | 2 |
| Too many newsgroups (meow) | 2 |
| Binary Image: misplaced gif | 1 |
| TOTAL: 10 | 83237 |
Miscellaneous innd statistics [Top 10]:
| Event | Server | Number |
|---|---|---|
| Bad Message-ID's offered | ||
| chimia.se | 2 | |
| TOTAL: 1 | 2 | |
| Including strange strings | ||
| chimia.se | 3 | |
| TOTAL: 1 | 3 | |
| TOTAL: 2 | 5 | |
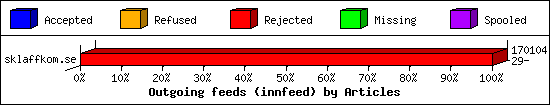
Outgoing Feeds (innfeed) by Articles:
| Server | Offered | Taken | Refused | Reject | Miss | Spool | %Took | Elapsed | |
|---|---|---|---|---|---|---|---|---|---|
| 1 | sklaffkom.se | 170104 | 29 | 22 | 170053 | 0 | 0 | 0% | 23:59:59 |
| 2 | sklaff.dev | 0 | 0 | 0 | 0 | 0 | 173727 | 0% | 23:57:44 |
| 3 | thebunker.nu | 0 | 0 | 0 | 0 | 0 | 173727 | 0% | 23:59:59 |
| 4 | usenet.blueworldhosting.com | 0 | 0 | 0 | 0 | 0 | 3164 | 0% | 23:59:58 |
| TOTAL: 4 | 170104 | 29 | 22 | 170053 | 0 | 350618 | 0% | 95:57:40 | |
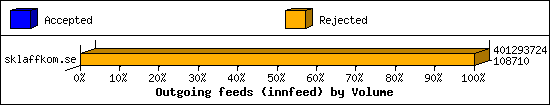
Outgoing Feeds (innfeed) by Volume:
| Server | AcceptVol | RejectVol | TotalVol | Volume/sec | Vol/Art | Elapsed | |
|---|---|---|---|---|---|---|---|
| 1 | sklaffkom.se | 106.2 KB | 382.6 MB | 382.7 MB | 4.5 KB/s | 2.3 KB | 23:59:59 |
| 2 | sklaff.dev | 0.0 KB | 0.0 KB | 0.0 KB | 0.0 KB/s | 0 | 23:57:44 |
| 3 | thebunker.nu | 0.0 KB | 0.0 KB | 0.0 KB | 0.0 KB/s | 0 | 23:59:59 |
| 4 | usenet.blueworldhosting.com | 0.0 KB | 0.0 KB | 0.0 KB | 0.0 KB/s | 0 | 23:59:58 |
| TOTAL: 4 | 106.2 KB | 382.6 MB | 382.7 MB | 1.1 KB/s | 2.3 KB | 95:57:40 | |
NNRP readership statistics:
| System | Conn | Arts | Size | Groups | Post | Rej | Elapsed | |
|---|---|---|---|---|---|---|---|---|
| 1 | 66.61.98.95 | 4 | 4 | 7.5 KB | 2 | 0 | 0 | 00:17:54 |
| TOTAL: 1 | 4 | 4 | 7.5 KB | 2 | 0 | 0 | 00:19:49 | |
NNRP readership statistics (by domain):
| System | Conn | Arts | Size | Groups | Post | Rej | Elapsed | |
|---|---|---|---|---|---|---|---|---|
| 1 | unresolved | 22 | 4 | 7.5 KB | 2 | 0 | 0 | 00:19:16 |
| 2 | *.monitoring.internet-measurement.com | 6 | 0 | 0.0 KB | 0 | 0 | 0 | 00:00:06 |
| 3 | *.150.216.162.bc.googleusercontent.com | 3 | 0 | 0.0 KB | 0 | 0 | 0 | 00:00:15 |
| 4 | *.stretchoid.com | 2 | 0 | 0.0 KB | 0 | 0 | 0 | 00:00:10 |
| 5 | *.scanner.modat.io | 1 | 0 | 0.0 KB | 0 | 0 | 0 | 00:00:00 |
| TOTAL: 5 | 34 | 4 | 7.5 KB | 2 | 0 | 0 | 00:19:49 | |
NNRP total resource statistics [Top 20]:
| System | User(ms) | System(ms) | Idle(ms) | Elapsed |
|---|---|---|---|---|
| 66.61.98.95 | 0.050 | 0.116 | 0.000 | 00:17:54 |
| 206.168.34.118 | 0.068 | 0.023 | 0.000 | 00:00:44 |
| 140.150.216.162.bc.googleusercontent.com | 0.085 | 0.009 | 0.000 | 00:00:15 |
| 147.185.133.154 | 0.079 | 0.011 | 0.000 | 00:00:11 |
| 152.32.149.19 | 0.020 | 0.014 | 0.000 | 00:00:10 |
| azpdcsod03rr.stretchoid.com | 0.015 | 0.013 | 0.000 | 00:00:10 |
| 80.94.92.21 | 0.005 | 0.008 | 0.000 | 00:00:06 |
| 162.142.125.112 | 0.058 | 0.011 | 0.000 | 00:00:05 |
| invincible.monitoring.internet-measurement.com | 0.041 | 0.004 | 0.000 | 00:00:03 |
| flourishing.monitoring.internet-measurement.com | 0.039 | 0.010 | 0.000 | 00:00:03 |
| 147.185.132.40 | 0.008 | 0.005 | 0.000 | 00:00:01 |
| 147.185.132.219 | 0.006 | 0.005 | 0.000 | 00:00:01 |
| 213.150.216.162.bc.googleusercontent.com | 0.042 | 0.003 | 0.000 | 00:00:00 |
| 147.185.133.242 | 0.041 | 0.005 | 0.000 | 00:00:00 |
| o316.scanner.modat.io | 0.009 | 0.013 | 0.000 | 00:00:00 |
| 203.55.131.5 | 0.007 | 0.005 | 0.000 | 00:00:00 |
| lucent.monitoring.internet-measurement.com | 0.040 | 0.003 | 0.000 | 00:00:00 |
| robust.monitoring.internet-measurement.com | 0.041 | 0.003 | 0.000 | 00:00:00 |
| talented.monitoring.internet-measurement.com | 0.036 | 0.007 | 0.000 | 00:00:00 |
| TOTAL: 19 | 0.690 | 0.268 | 0.000 | 00:19:49 |
Curious NNRP server explorers [Top 20]:
| System | Conn |
|---|---|
| 206.168.34.118 | 5 |
| 152.32.149.19 | 3 |
| 162.142.125.112 | 3 |
| 140.150.216.162.bc.googleusercontent.com | 2 |
| 147.185.133.154 | 2 |
| azpdcsod03rr.stretchoid.com | 2 |
| 147.185.132.219 | 1 |
| 147.185.132.40 | 1 |
| 147.185.133.242 | 1 |
| 203.55.131.5 | 1 |
| 213.150.216.162.bc.googleusercontent.com | 1 |
| 80.94.92.21 | 1 |
| flourishing.monitoring.internet-measurement.com | 1 |
| invincible.monitoring.internet-measurement.com | 1 |
| lucent.monitoring.internet-measurement.com | 1 |
| luminous.monitoring.internet-measurement.com | 1 |
| o316.scanner.modat.io | 1 |
| robust.monitoring.internet-measurement.com | 1 |
| talented.monitoring.internet-measurement.com | 1 |
| TOTAL: 19 | 30 |
NNRP gethostbyaddr failures [Top 20]:
| System | Conn |
|---|---|
| ? (can't getpeername) | 10 |
| TOTAL: 1 | 10 |
NNRP unrecognized commands (by host) [Top 20]:
| System | Conn |
|---|---|
| 140.150.216.162.bc.googleusercontent.com | 4 |
| 147.185.133.154 | 4 |
| 147.185.133.242 | 4 |
| 213.150.216.162.bc.googleusercontent.com | 4 |
| 206.168.34.118 | 3 |
| 152.32.149.19 | 2 |
| 80.94.92.21 | 2 |
| 162.142.125.112 | 1 |
| azpdcsod03rr.stretchoid.com | 1 |
| TOTAL: 9 | 25 |
NNRP unrecognized commands (by command) [Top 20]:
| Command | Count |
|---|---|
| GET / HTTP/1.1 | 4 |
| Host: 109.238.130.155:563 | 4 |
| #026#003#001 | 3 |
| Accept-Encoding: gzip | 2 |
| Accept: */* | 2 |
| EHLO www.censys.io | 2 |
| User-Agent: Hello from Palo Alto Network... | 2 |
| User-Agent: curl/7.68.0 | 2 |
| #001 | 1 |
| #023#003#023#001#023#002#001 | 1 |
| MGLNDD_109.238.130.155_119 | 1 |
| À#024 | 1 |
| TOTAL: 12 | 25 |
NNRP client timeouts [Top 20]:
| System | Conn | Peer |
|---|---|---|
| 206.168.34.118 | 2 | 2 |
| 140.150.216.162.bc.googleusercontent.com | 1 | 2 |
| 147.185.133.154 | 1 | 2 |
| 147.185.133.242 | 1 | 1 |
| 162.142.125.112 | 1 | 2 |
| 213.150.216.162.bc.googleusercontent.com | 1 | 1 |
| 80.94.92.21 | 1 | 1 |
| TOTAL: 7 | 8 | 14 |
Newsgroup request counts (by hierarchy):
| Hierarchy | Count | Pct | |
|---|---|---|---|
| 1 | alt | 2 | 50.0% |
| 2 | comp | 2 | 50.0% |
| TOTAL: 2 | 4 | 100.0% | |
Newsgroup request counts (by newsgroup) [Top 100]:
| Newsgroup | Count | |
|---|---|---|
| 1 | alt.music.who | 2 |
| 2 | comp.unix.sys5.r4 | 2 |
| TOTAL: 2 | 4 | |