Unknown entries from news log file:
First 1 / 1 lines (100.0%)
Log entries by program:
| Program name | Lines | %Lines | Size | %Size |
|---|---|---|---|---|
| inn | 249599 | 81.9% | 40.7 MB | 85.5% |
| innd | 52655 | 17.3% | 6.6 MB | 13.9% |
| innfeed | 2421 | 0.8% | 285.3 KB | 0.6% |
| nnrpd | 266 | 0.1% | 26.6 KB | 0.1% |
| controlchan | 1 | 0.0% | 0.1 KB | 0.0% |
| TOTAL: 5 | 304942 | 100.0% | 47.6 MB | 100.0% |
History cache:
| Reason | Count | %Count |
|---|---|---|
| Do not exist | 249395 | 50.2% |
| Negative hits | 246002 | 49.6% |
| Cache misses | 828 | 0.2% |
| Positive hits | 157 | 0.0% |
| TOTAL: 4 | 496382 | 100.0% |
INND timer:
| Code region | Time | Pct | Invoked | Min(ms) | Avg(ms) | Max(ms) |
|---|---|---|---|---|---|---|
| article cancel | 00:00:00.000 | 0.0% | 2 | 0.000 | 0.000 | 0.000 |
| article cleanup | 00:00:01.314 | 0.0% | 249680 | 0.000 | 0.005 | 0.210 |
| article logging | 00:00:04.443 | 0.0% | 249681 | 0.000 | 0.018 | 0.105 |
| article parse | 00:00:02.283 | 0.0% | 752482 | 0.000 | 0.003 | 0.017 |
| article write | 00:01:43.922 | 0.1% | 205732 | 0.000 | 0.505 | 21.000 |
| artlog/artparse | 00:00:00.000 | 0.0% | 0 | 0.000 | 0.000 | 0.000 |
| artlog/artwrite | 00:00:00.000 | 0.0% | 0 | 0.000 | 0.000 | 0.000 |
| data move | 00:00:00.304 | 0.0% | 775533 | 0.000 | 0.000 | 0.008 |
| hisgrep/artcncl | 00:00:00.000 | 0.0% | 2 | 0.000 | 0.000 | 0.000 |
| hishave/artparse | 00:00:00.000 | 0.0% | 0 | 0.000 | 0.000 | 0.000 |
| hissync/artwrite | 00:00:00.000 | 0.0% | 0 | 0.000 | 0.000 | 0.000 |
| history grep | 00:00:00.000 | 0.0% | 0 | 0.000 | 0.000 | 0.000 |
| history lookup | 00:09:58.933 | 0.7% | 496963 | 0.003 | 1.205 | 10.727 |
| history sync | 00:00:00.012 | 0.0% | 309 | 0.000 | 0.039 | 1.000 |
| history write | 00:05:22.783 | 0.4% | 249680 | 0.118 | 1.293 | 7.085 |
| hiswrite/artparse | 00:00:00.000 | 0.0% | 0 | 0.000 | 0.000 | 0.000 |
| idle | 23:36:26.386 | 98.3% | 753974 | 21.694 | 112.718 | 60060.000 |
| nntp read | 00:00:06.982 | 0.0% | 753759 | 0.000 | 0.009 | 0.775 |
| overview write | 00:00:18.195 | 0.0% | 205732 | 0.000 | 0.088 | 4.429 |
| perl filter | 00:05:32.493 | 0.4% | 249680 | 0.453 | 1.332 | 9.667 |
| python filter | 00:00:14.044 | 0.0% | 496663 | 0.000 | 0.028 | 0.377 |
| site send | 00:00:01.828 | 0.0% | 205732 | 0.000 | 0.009 | 0.048 |
| TOTAL: 24:00:27.225 | 23:59:53.922 | 100.0% | - | - | - | - |
INNfeed timer:
| Code region | Time | Pct | Invoked | Min(ms) | Avg(ms) | Max(ms) |
|---|---|---|---|---|---|---|
| article new | 00:00:00.356 | 0.0% | 205522 | 0.000 | 0.002 | 0.023 |
| article prepare | 00:00:00.061 | 0.0% | 803976 | 0.000 | 0.000 | 0.003 |
| article read | 00:00:19.019 | 0.0% | 200994 | 0.000 | 0.095 | 1.645 |
| backlog stats | 00:00:00.248 | 0.0% | 1016157 | 0.000 | 0.000 | 0.004 |
| callbacks | 00:00:00.000 | 0.0% | 0 | 0.000 | 0.000 | 0.000 |
| data read | 00:00:04.310 | 0.0% | 608392 | 0.000 | 0.007 | 0.034 |
| data write | 00:00:06.591 | 0.0% | 402939 | 0.000 | 0.016 | 0.062 |
| idle | 23:58:26.208 | 100.0% | 1016157 | 37.124 | 84.934 | 20058.333 |
| status file | 00:00:00.097 | 0.0% | 201 | 0.000 | 0.483 | 8.000 |
| TOTAL: 23:59:07.334 | 23:58:56.890 | 100.0% | - | - | - | - |
nnrpd timer:
| Code region | Time | Pct | Invoked | Min(ms) | Avg(ms) | Max(ms) |
|---|---|---|---|---|---|---|
| idle | 00:05:40.399 | 85.3% | 99 | 52.500 | 3438.374 | 10349.562 |
| newnews | 00:00:00.000 | 0.0% | 0 | 0.000 | 0.000 | 0.000 |
| nntpwrite | 00:00:00.598 | 0.1% | 417 | 0.000 | 1.434 | 7.255 |
| readart | 00:00:00.066 | 0.0% | 10 | 5.500 | 6.600 | 7.500 |
| TOTAL: 00:06:38.873 | 00:05:41.063 | 85.5% | - | - | - | - |
Control commands to INND:
| Command | Number |
|---|---|
| flush | 2 |
| flushlogs | 2 |
| go | 2 |
| logmode | 2 |
| lowmark | 1 |
| mode | 146 |
| name | 2 |
| pause | 2 |
| paused | 2 |
| reload | 2 |
| reserve | 2 |
| TOTAL: 11 | 165 |
Incoming Feeds (INN):
| Server | Connects | Offered | Taken | Refused | Reject | %Accpt | Elapsed | |
|---|---|---|---|---|---|---|---|---|
| 1 | chimia.se | 2 | 246832 | 201934 | 985 | 43913 | 81% | 23:53:27 |
| 2 | news.sklaffkom.se | 2 | 3687 | 3687 | 0 | 0 | 100% | 23:58:40 |
| 3 | localhost | 25 | 0 | 0 | 0 | 0 | 0% | 00:00:00 |
| TOTAL: 3 | 29 | 250519 | 205621 | 985 | 43913 | 82% | 47:52:07 | |
Incoming Volume (INN):
| Server | AcceptVol | DupVol | RejVol | TotalVol | %Acc | Vol/Art | |
|---|---|---|---|---|---|---|---|
| 1 | chimia.se | 464.1 MB | 0.0 KB | 108.8 MB | 572.9 MB | 81% | 2.4 KB |
| 2 | news.sklaffkom.se | 5.1 MB | 0.0 KB | 0.0 KB | 5.1 MB | 100% | 1.4 KB |
| 3 | localhost | 0.0 KB | 0.0 KB | 0.0 KB | 0.0 KB | 0% | 0 |
| TOTAL: 3 | 469.1 MB | 0.0 KB | 108.8 MB | 577.9 MB | 81% | 2.4 KB | |
Incoming articles:
| Date | Articles | %Arts | Art/sec | Size | %Size | KB/sec |
|---|---|---|---|---|---|---|
| Jan 13 03:00:02 - 03:59:59 | 8082 | 3.9% | 2.25 | 19.6 MB | 4.2% | 5.58 |
| Jan 13 04:00:00 - 04:59:59 | 7864 | 3.8% | 2.18 | 21.0 MB | 4.5% | 5.99 |
| Jan 13 05:00:00 - 05:59:59 | 7804 | 3.8% | 2.17 | 21.1 MB | 4.5% | 6.00 |
| Jan 13 06:00:00 - 06:59:59 | 9176 | 4.5% | 2.55 | 20.9 MB | 4.5% | 5.94 |
| Jan 13 07:00:00 - 07:59:59 | 8943 | 4.3% | 2.48 | 20.9 MB | 4.5% | 5.96 |
| Jan 13 08:00:00 - 08:59:59 | 7603 | 3.7% | 2.11 | 18.0 MB | 3.8% | 5.11 |
| Jan 13 09:00:00 - 09:59:59 | 7187 | 3.5% | 2.00 | 17.2 MB | 3.7% | 4.90 |
| Jan 13 10:00:00 - 10:59:59 | 6406 | 3.1% | 1.78 | 18.1 MB | 3.8% | 5.14 |
| Jan 13 11:00:00 - 11:59:59 | 8566 | 4.2% | 2.38 | 28.3 MB | 6.0% | 8.06 |
| Jan 13 12:00:00 - 12:59:59 | 8893 | 4.3% | 2.47 | 34.9 MB | 7.4% | 9.92 |
| Jan 13 13:00:00 - 13:59:59 | 6866 | 3.3% | 1.91 | 19.1 MB | 4.1% | 5.45 |
| Jan 13 14:00:00 - 14:59:59 | 6755 | 3.3% | 1.88 | 11.9 MB | 2.5% | 3.39 |
| Jan 13 15:00:00 - 15:59:59 | 8622 | 4.2% | 2.40 | 14.7 MB | 3.1% | 4.18 |
| Jan 13 16:00:00 - 16:59:59 | 8857 | 4.3% | 2.46 | 14.9 MB | 3.2% | 4.24 |
| Jan 13 17:00:00 - 17:59:59 | 9047 | 4.4% | 2.51 | 19.1 MB | 4.1% | 5.44 |
| Jan 13 18:00:00 - 18:59:59 | 8123 | 3.9% | 2.26 | 20.6 MB | 4.4% | 5.87 |
| Jan 13 19:00:00 - 19:59:59 | 9047 | 4.4% | 2.51 | 17.1 MB | 3.6% | 4.85 |
| Jan 13 20:00:00 - 20:59:59 | 9187 | 4.5% | 2.55 | 16.9 MB | 3.6% | 4.80 |
| Jan 13 21:00:00 - 21:59:59 | 9329 | 4.5% | 2.59 | 17.1 MB | 3.6% | 4.86 |
| Jan 13 22:00:00 - 22:59:59 | 10084 | 4.9% | 2.80 | 18.3 MB | 3.9% | 5.20 |
| Jan 13 23:00:00 - 23:59:59 | 9972 | 4.8% | 2.77 | 18.3 MB | 3.9% | 5.21 |
| Jan 14 00:00:00 - 00:59:59 | 9947 | 4.8% | 2.76 | 20.2 MB | 4.3% | 5.75 |
| Jan 14 01:00:00 - 01:59:59 | 9592 | 4.7% | 2.66 | 19.1 MB | 4.1% | 5.44 |
| Jan 14 02:00:00 - 02:59:59 | 9723 | 4.7% | 2.70 | 21.7 MB | 4.6% | 6.17 |
| Jan 14 03:00:00 - 03:00:02 | 8 | 0.0% | 4.00 | 16.3 KB | 0.0% | 8.13 |
| TOTAL: 24:00:00 | 205683 | 100.0% | 2.38 | 469.2 MB | 100.0% | 5.56 |
Sites sending bad articles:
| Server | Total | Group | Dist | Duplic | Unapp | TooOld | Site | Line | Other | |
|---|---|---|---|---|---|---|---|---|---|---|
| 1 | chimia.se | 43916 | 0 | 0 | 0 | 0 | 0 | 0 | 0 | 43916 |
| TOTAL: 1 | 43916 | 0 | 0 | 0 | 0 | 0 | 0 | 0 | 43916 | |
INND Perl filter [Top 20]:
| Reason | Count |
|---|---|
| EMP (phn nph) | 19440 |
| EMP (phl) | 13932 |
| EMP (phn path) | 6281 |
| EMP (md5) | 2710 |
| Scoring filter | 548 |
| HTML Multipart | 546 |
| Subject Rejected | 292 |
| EMP (fsl) | 43 |
| MI5 Filter | 41 |
| Too many newsgroups | 28 |
| Too many newsgroups (low_xpost) | 28 |
| Too many newsgroups (meow) | 11 |
| hierarchy violation - crosspost outside netscape | 9 |
| Binary Image: misplaced gif | 3 |
| Binary: misplaced binary | 1 |
| HTML file attachment | 1 |
| PFM bot misc | 1 |
| TOTAL: 17 | 43915 |
Miscellaneous innd statistics [Top 10]:
| Event | Server | Number |
|---|---|---|
| Bad Message-ID's offered | ||
| chimia.se | 20 | |
| TOTAL: 1 | 20 | |
| Including strange strings | ||
| chimia.se | 1 | |
| TOTAL: 1 | 1 | |
| TOTAL: 2 | 21 | |
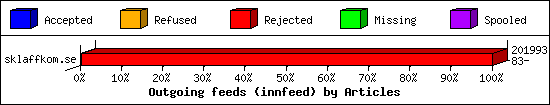
Outgoing Feeds (innfeed) by Articles:
| Server | Offered | Taken | Refused | Reject | Miss | Spool | %Took | Elapsed | |
|---|---|---|---|---|---|---|---|---|---|
| 1 | sklaffkom.se | 201993 | 83 | 854 | 201056 | 0 | 0 | 0% | 23:59:58 |
| 2 | sklaff.dev | 0 | 0 | 0 | 0 | 0 | 205680 | 0% | 23:57:43 |
| 3 | thebunker.nu | 0 | 0 | 0 | 0 | 0 | 205680 | 0% | 23:59:58 |
| 4 | usenet.blueworldhosting.com | 0 | 0 | 0 | 0 | 0 | 98233 | 0% | 23:59:57 |
| TOTAL: 4 | 201993 | 83 | 854 | 201056 | 0 | 509593 | 0% | 95:57:36 | |
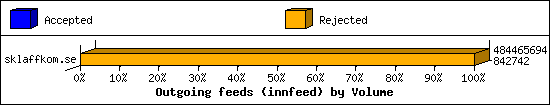
Outgoing Feeds (innfeed) by Volume:
| Server | AcceptVol | RejectVol | TotalVol | Volume/sec | Vol/Art | Elapsed | |
|---|---|---|---|---|---|---|---|
| 1 | sklaffkom.se | 823.0 KB | 461.2 MB | 462.0 MB | 5.5 KB/s | 2.4 KB | 23:59:58 |
| 2 | sklaff.dev | 0.0 KB | 0.0 KB | 0.0 KB | 0.0 KB/s | 0 | 23:57:43 |
| 3 | thebunker.nu | 0.0 KB | 0.0 KB | 0.0 KB | 0.0 KB/s | 0 | 23:59:58 |
| 4 | usenet.blueworldhosting.com | 0.0 KB | 0.0 KB | 0.0 KB | 0.0 KB/s | 0 | 23:59:57 |
| TOTAL: 4 | 823.0 KB | 461.2 MB | 462.0 MB | 1.4 KB/s | 2.4 KB | 95:57:36 | |
NNRP readership statistics:
| System | Conn | Arts | Size | Groups | Post | Rej | Elapsed | |
|---|---|---|---|---|---|---|---|---|
| 1 | 66.61.98.95 | 10 | 10 | 25.0 KB | 5 | 0 | 0 | 00:05:22 |
| TOTAL: 1 | 10 | 10 | 25.0 KB | 5 | 0 | 0 | 00:06:38 | |
NNRP readership statistics (by domain):
| System | Conn | Arts | Size | Groups | Post | Rej | Elapsed | |
|---|---|---|---|---|---|---|---|---|
| 1 | unresolved | 21 | 10 | 25.0 KB | 5 | 0 | 0 | 00:06:15 |
| 2 | *.scanner.modat.io | 5 | 0 | 0.0 KB | 0 | 0 | 0 | 00:00:00 |
| 3 | *.probe.onyphe.net | 4 | 0 | 0.0 KB | 0 | 0 | 0 | 00:00:06 |
| 4 | *.150.216.162.bc.googleusercontent.com | 3 | 0 | 0.0 KB | 0 | 0 | 0 | 00:00:03 |
| 5 | *.stretchoid.com | 2 | 0 | 0.0 KB | 0 | 0 | 0 | 00:00:10 |
| 6 | *.149.216.162.bc.googleusercontent.com | 1 | 0 | 0.0 KB | 0 | 0 | 0 | 00:00:00 |
| 7 | *.monitoring.internet-measurement.com | 1 | 0 | 0.0 KB | 0 | 0 | 0 | 00:00:01 |
| TOTAL: 7 | 37 | 10 | 25.0 KB | 5 | 0 | 0 | 00:06:38 | |
NNRP total resource statistics [Top 20]:
| System | User(ms) | System(ms) | Idle(ms) | Elapsed |
|---|---|---|---|---|
| 66.61.98.95 | 0.107 | 0.149 | 0.000 | 00:05:22 |
| 147.185.132.139 | 0.160 | 0.021 | 0.000 | 00:00:42 |
| azpdcgme57my.stretchoid.com | 0.014 | 0.010 | 0.000 | 00:00:10 |
| 205.210.31.41 | 0.007 | 0.007 | 0.000 | 00:00:03 |
| 66.132.153.116 | 0.052 | 0.015 | 0.000 | 00:00:03 |
| 152.150.216.162.bc.googleusercontent.com | 0.085 | 0.005 | 0.000 | 00:00:03 |
| carrillo.probe.onyphe.net | 0.008 | 0.004 | 0.000 | 00:00:03 |
| knapp.probe.onyphe.net | 0.007 | 0.005 | 0.000 | 00:00:02 |
| 198.235.24.179 | 0.008 | 0.003 | 0.000 | 00:00:02 |
| enthralling.monitoring.internet-measurement.com | 0.007 | 0.006 | 0.000 | 00:00:01 |
| cook.probe.onyphe.net | 0.007 | 0.004 | 0.000 | 00:00:00 |
| o301.scanner.modat.io | 0.200 | 0.026 | 0.000 | 00:00:00 |
| 194.149.216.162.bc.googleusercontent.com | 0.037 | 0.010 | 0.000 | 00:00:00 |
| 116.150.216.162.bc.googleusercontent.com | 0.040 | 0.007 | 0.000 | 00:00:00 |
| 66.132.153.123 | 0.040 | 0.004 | 0.000 | 00:00:00 |
| villegas.probe.onyphe.net | 0.008 | 0.005 | 0.000 | 00:00:00 |
| 147.185.132.255 | 0.007 | 0.006 | 0.000 | 00:00:00 |
| TOTAL: 17 | 0.794 | 0.287 | 0.000 | 00:06:38 |
Curious NNRP server explorers [Top 20]:
| System | Conn |
|---|---|
| o301.scanner.modat.io | 5 |
| 147.185.132.139 | 4 |
| 66.132.153.116 | 3 |
| 152.150.216.162.bc.googleusercontent.com | 2 |
| azpdcgme57my.stretchoid.com | 2 |
| 116.150.216.162.bc.googleusercontent.com | 1 |
| 147.185.132.255 | 1 |
| 194.149.216.162.bc.googleusercontent.com | 1 |
| 198.235.24.179 | 1 |
| 205.210.31.41 | 1 |
| 66.132.153.123 | 1 |
| carrillo.probe.onyphe.net | 1 |
| cook.probe.onyphe.net | 1 |
| enthralling.monitoring.internet-measurement.com | 1 |
| knapp.probe.onyphe.net | 1 |
| villegas.probe.onyphe.net | 1 |
| TOTAL: 16 | 27 |
NNRP gethostbyaddr failures [Top 20]:
| System | Conn |
|---|---|
| ? (can't getpeername) | 10 |
| TOTAL: 1 | 10 |
NNRP unrecognized commands (by host) [Top 20]:
| System | Conn |
|---|---|
| 147.185.132.139 | 8 |
| 116.150.216.162.bc.googleusercontent.com | 4 |
| 152.150.216.162.bc.googleusercontent.com | 4 |
| 194.149.216.162.bc.googleusercontent.com | 4 |
| cook.probe.onyphe.net | 2 |
| villegas.probe.onyphe.net | 2 |
| 66.132.153.116 | 1 |
| 66.132.153.123 | 1 |
| azpdcgme57my.stretchoid.com | 1 |
| o301.scanner.modat.io | 1 |
| TOTAL: 10 | 28 |
NNRP unrecognized commands (by command) [Top 20]:
| Command | Count |
|---|---|
| GET / HTTP/1.1 | 5 |
| Host: 109.238.130.155:563 | 5 |
| Accept: */* | 3 |
| User-Agent: curl/7.68.0 | 3 |
| #026#003#003#001¨#001 | 2 |
| Accept-Encoding: gzip | 2 |
| EHLO www.censys.io | 2 |
| User-Agent: Hello from Palo Alto Network... | 2 |
| À$ÀÀ¯À,ÀrÀsÌ©#023#002#023#001Ì#024À#007À#022À#023À'À/À#024À(À0À`Àa... | 2 |
| HELO | 1 |
| MGLNDD_109.238.130.155_119 | 1 |
| TOTAL: 11 | 28 |
NNRP client timeouts [Top 20]:
| System | Conn | Peer |
|---|---|---|
| 147.185.132.139 | 2 | 3 |
| 116.150.216.162.bc.googleusercontent.com | 1 | 1 |
| 152.150.216.162.bc.googleusercontent.com | 1 | 2 |
| 194.149.216.162.bc.googleusercontent.com | 1 | 1 |
| 66.132.153.116 | 1 | 2 |
| o301.scanner.modat.io | 1 | 1 |
| TOTAL: 6 | 7 | 13 |
Newsgroup request counts (by hierarchy):
| Hierarchy | Count | Pct | |
|---|---|---|---|
| 1 | alt | 8 | 80.0% |
| 2 | comp | 2 | 20.0% |
| TOTAL: 2 | 10 | 100.0% | |
Newsgroup request counts (by newsgroup) [Top 100]:
| Newsgroup | Count | |
|---|---|---|
| 1 | alt.food.olives-or-olive-oil | 2 |
| 2 | alt.ham-radio | 2 |
| 3 | alt.music.pet-shop-boys | 2 |
| 4 | alt.startrek.creative | 2 |
| 5 | comp.sys.next.sysadmin | 2 |
| TOTAL: 5 | 10 | |