Unknown entries from news log file:
First 2 / 2 lines (100.0%)
Log entries by program:
| Program name | Lines | %Lines | Size | %Size |
|---|---|---|---|---|
| inn | 263728 | 62.9% | 36.5 MB | 67.3% |
| innd | 153237 | 36.5% | 17.4 MB | 32.1% |
| innfeed | 2408 | 0.6% | 281.3 KB | 0.5% |
| nnrpd | 124 | 0.0% | 12.8 KB | 0.0% |
| controlchan | 12 | 0.0% | 2.5 KB | 0.0% |
| pgpverify | 1 | 0.0% | 0.1 KB | 0.0% |
| TOTAL: 6 | 419510 | 100.0% | 54.2 MB | 100.0% |
History cache:
| Reason | Count | %Count |
|---|---|---|
| Do not exist | 263628 | 50.2% |
| Negative hits | 260246 | 49.6% |
| Cache misses | 1072 | 0.2% |
| Positive hits | 120 | 0.0% |
| TOTAL: 4 | 525066 | 100.0% |
INND timer:
| Code region | Time | Pct | Invoked | Min(ms) | Avg(ms) | Max(ms) |
|---|---|---|---|---|---|---|
| article cancel | 00:00:00.135 | 0.0% | 155 | 0.000 | 0.871 | 51.000 |
| article cleanup | 00:00:01.351 | 0.0% | 263722 | 0.000 | 0.005 | 0.165 |
| article logging | 00:00:04.026 | 0.0% | 263733 | 0.000 | 0.015 | 0.230 |
| article parse | 00:00:02.566 | 0.0% | 792761 | 0.000 | 0.003 | 0.012 |
| article write | 00:02:38.672 | 0.2% | 119315 | 0.000 | 1.330 | 100.294 |
| artlog/artparse | 00:00:00.000 | 0.0% | 0 | 0.000 | 0.000 | 0.000 |
| artlog/artwrite | 00:00:00.000 | 0.0% | 0 | 0.000 | 0.000 | 0.000 |
| data move | 00:00:00.305 | 0.0% | 810358 | 0.000 | 0.000 | 0.024 |
| hisgrep/artcncl | 00:00:00.080 | 0.0% | 155 | 0.000 | 0.516 | 4.600 |
| hishave/artparse | 00:00:00.000 | 0.0% | 0 | 0.000 | 0.000 | 0.000 |
| hissync/artwrite | 00:00:00.000 | 0.0% | 0 | 0.000 | 0.000 | 0.000 |
| history grep | 00:00:00.000 | 0.0% | 0 | 0.000 | 0.000 | 0.000 |
| history lookup | 00:13:36.758 | 0.9% | 525277 | 0.000 | 1.555 | 9.611 |
| history sync | 00:00:00.008 | 0.0% | 299 | 0.000 | 0.027 | 1.500 |
| history write | 00:05:26.912 | 0.4% | 263722 | 0.000 | 1.240 | 6.381 |
| hiswrite/artparse | 00:00:00.000 | 0.0% | 0 | 0.000 | 0.000 | 0.000 |
| idle | 23:31:35.203 | 98.0% | 794418 | 46.355 | 106.613 | 60059.000 |
| nntp read | 00:00:07.126 | 0.0% | 794252 | 0.000 | 0.009 | 0.166 |
| overview write | 00:00:14.733 | 0.0% | 119315 | 0.000 | 0.123 | 20.000 |
| perl filter | 00:05:17.979 | 0.4% | 263722 | 0.353 | 1.206 | 283.000 |
| python filter | 00:00:14.841 | 0.0% | 524977 | 0.000 | 0.028 | 0.376 |
| site send | 00:00:01.040 | 0.0% | 119316 | 0.000 | 0.009 | 0.091 |
| TOTAL: 24:00:01.100 | 23:59:21.735 | 100.0% | - | - | - | - |
INNfeed timer:
| Code region | Time | Pct | Invoked | Min(ms) | Avg(ms) | Max(ms) |
|---|---|---|---|---|---|---|
| article new | 00:00:00.199 | 0.0% | 119219 | 0.000 | 0.002 | 0.050 |
| article prepare | 00:00:00.038 | 0.0% | 460196 | 0.000 | 0.000 | 0.006 |
| article read | 00:00:12.914 | 0.0% | 115049 | 0.000 | 0.112 | 3.935 |
| backlog stats | 00:00:00.152 | 0.0% | 585424 | 0.000 | 0.000 | 0.009 |
| callbacks | 00:00:00.000 | 0.0% | 0 | 0.000 | 0.000 | 0.000 |
| data read | 00:00:02.205 | 0.0% | 349874 | 0.000 | 0.006 | 0.035 |
| data write | 00:00:03.655 | 0.0% | 230726 | 0.000 | 0.016 | 0.109 |
| idle | 23:59:03.180 | 100.0% | 585424 | 53.392 | 147.488 | 15309.250 |
| status file | 00:00:00.138 | 0.0% | 201 | 0.000 | 0.687 | 29.667 |
| TOTAL: 23:59:28.554 | 23:59:22.481 | 100.0% | - | - | - | - |
nnrpd timer:
| Code region | Time | Pct | Invoked | Min(ms) | Avg(ms) | Max(ms) |
|---|---|---|---|---|---|---|
| idle | 00:00:11.870 | 50.3% | 8 | 31.000 | 1483.750 | 10013.000 |
| newnews | 00:00:00.000 | 0.0% | 0 | 0.000 | 0.000 | 0.000 |
| nntpwrite | 00:00:00.000 | 0.0% | 76 | 0.000 | 0.000 | 0.000 |
| TOTAL: 00:00:23.586 | 00:00:11.870 | 50.3% | - | - | - | - |
Control commands to INND:
| Command | Number |
|---|---|
| flush | 2 |
| flushlogs | 2 |
| go | 2 |
| logmode | 2 |
| lowmark | 1 |
| mode | 145 |
| name | 2 |
| pause | 2 |
| paused | 2 |
| reload | 2 |
| reserve | 2 |
| TOTAL: 11 | 164 |
Control Channel:
| Sender | newgroup | rmgroup | Other | Bad PGP | DoIt | OK |
|---|---|---|---|---|---|---|
| newgroups-request@fido7.org | 0 | 0 | 1 | 1 | 0 | 1 |
| TOTAL | 0 | 0 | 1 | 1 | 0 | 1 |
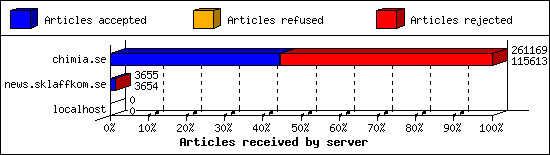
Incoming Feeds (INN):
| Server | Connects | Offered | Taken | Refused | Reject | %Accpt | Elapsed | |
|---|---|---|---|---|---|---|---|---|
| 1 | chimia.se | 2 | 261169 | 115613 | 1192 | 144364 | 44% | 23:54:16 |
| 2 | news.sklaffkom.se | 2 | 3655 | 3654 | 0 | 1 | 99% | 23:59:16 |
| 3 | localhost | 25 | 0 | 0 | 0 | 0 | 0% | 00:00:00 |
| TOTAL: 3 | 29 | 264824 | 119267 | 1192 | 144365 | 45% | 47:53:32 | |
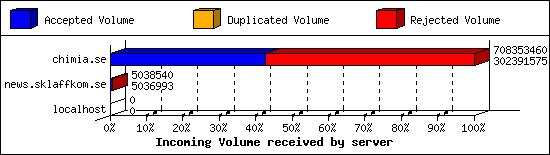
Incoming Volume (INN):
| Server | AcceptVol | DupVol | RejVol | TotalVol | %Acc | Vol/Art | |
|---|---|---|---|---|---|---|---|
| 1 | chimia.se | 288.4 MB | 0.0 KB | 387.2 MB | 675.5 MB | 42% | 2.7 KB |
| 2 | news.sklaffkom.se | 4.8 MB | 0.0 KB | 1.5 KB | 4.8 MB | 99% | 1.3 KB |
| 3 | localhost | 0.0 KB | 0.0 KB | 0.0 KB | 0.0 KB | 0% | 0 |
| TOTAL: 3 | 293.2 MB | 0.0 KB | 387.2 MB | 680.3 MB | 43% | 2.6 KB | |
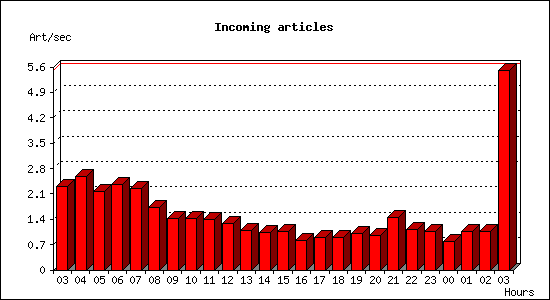
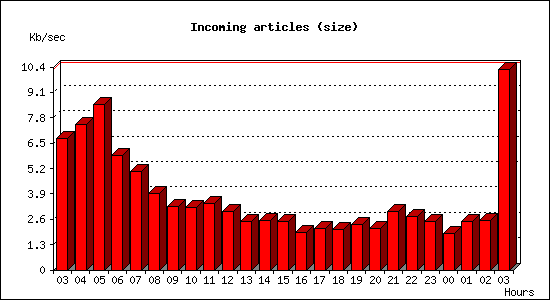
Incoming articles:
| Date | Articles | %Arts | Art/sec | Size | %Size | KB/sec |
|---|---|---|---|---|---|---|
| Jan 14 03:00:02 - 03:59:59 | 8252 | 6.9% | 2.29 | 23.7 MB | 8.1% | 6.75 |
| Jan 14 04:00:00 - 04:59:59 | 9241 | 7.7% | 2.57 | 26.1 MB | 8.9% | 7.43 |
| Jan 14 05:00:00 - 05:59:59 | 7814 | 6.6% | 2.17 | 29.8 MB | 10.2% | 8.47 |
| Jan 14 06:00:00 - 06:59:59 | 8467 | 7.1% | 2.35 | 20.6 MB | 7.0% | 5.87 |
| Jan 14 07:00:00 - 07:59:59 | 8094 | 6.8% | 2.25 | 17.7 MB | 6.0% | 5.04 |
| Jan 14 08:00:00 - 08:59:59 | 6192 | 5.2% | 1.72 | 13.9 MB | 4.7% | 3.94 |
| Jan 14 09:00:00 - 09:59:59 | 5075 | 4.3% | 1.41 | 11.3 MB | 3.9% | 3.23 |
| Jan 14 10:00:00 - 10:59:59 | 5075 | 4.3% | 1.41 | 11.2 MB | 3.8% | 3.19 |
| Jan 14 11:00:00 - 11:59:59 | 5001 | 4.2% | 1.39 | 11.9 MB | 4.1% | 3.39 |
| Jan 14 12:00:00 - 12:59:59 | 4579 | 3.8% | 1.27 | 10.5 MB | 3.6% | 3.00 |
| Jan 14 13:00:00 - 13:59:59 | 3945 | 3.3% | 1.10 | 8.8 MB | 3.0% | 2.49 |
| Jan 14 14:00:00 - 14:59:59 | 3738 | 3.1% | 1.04 | 8.8 MB | 3.0% | 2.51 |
| Jan 14 15:00:00 - 15:59:59 | 3833 | 3.2% | 1.06 | 8.7 MB | 3.0% | 2.46 |
| Jan 14 16:00:00 - 16:59:59 | 2940 | 2.5% | 0.82 | 6.8 MB | 2.3% | 1.93 |
| Jan 14 17:00:00 - 17:59:59 | 3276 | 2.7% | 0.91 | 7.4 MB | 2.5% | 2.10 |
| Jan 14 18:00:00 - 18:59:59 | 3179 | 2.7% | 0.88 | 7.3 MB | 2.5% | 2.07 |
| Jan 14 19:00:00 - 19:59:59 | 3632 | 3.0% | 1.01 | 8.1 MB | 2.8% | 2.32 |
| Jan 14 20:00:00 - 20:59:59 | 3379 | 2.8% | 0.94 | 7.4 MB | 2.5% | 2.11 |
| Jan 14 21:00:00 - 21:59:59 | 5210 | 4.4% | 1.45 | 10.6 MB | 3.6% | 3.02 |
| Jan 14 22:00:00 - 22:59:59 | 4048 | 3.4% | 1.12 | 9.6 MB | 3.3% | 2.72 |
| Jan 14 23:00:00 - 23:59:59 | 3778 | 3.2% | 1.05 | 8.8 MB | 3.0% | 2.50 |
| Jan 15 00:00:00 - 00:59:59 | 2817 | 2.4% | 0.78 | 6.5 MB | 2.2% | 1.86 |
| Jan 15 01:00:00 - 01:59:59 | 3865 | 3.2% | 1.07 | 8.7 MB | 3.0% | 2.49 |
| Jan 15 02:00:00 - 02:59:59 | 3831 | 3.2% | 1.06 | 8.8 MB | 3.0% | 2.51 |
| Jan 15 03:00:00 - 03:00:02 | 11 | 0.0% | 5.50 | 20.5 KB | 0.0% | 10.25 |
| TOTAL: 24:00:00 | 119272 | 100.0% | 1.38 | 293.2 MB | 100.0% | 3.48 |
Sites sending bad articles:
| Server | Total | Group | Dist | Duplic | Unapp | TooOld | Site | Line | Other | |
|---|---|---|---|---|---|---|---|---|---|---|
| 1 | chimia.se | 144455 | 0 | 0 | 0 | 1 | 0 | 0 | 0 | 144454 |
| 2 | news.sklaffkom.se | 1 | 0 | 0 | 0 | 0 | 0 | 0 | 0 | 1 |
| TOTAL: 2 | 144456 | 0 | 0 | 0 | 1 | 0 | 0 | 0 | 144455 | |
Supposedly-moderated groups with unmoderated postings [Top 20]:
| Groups | Count |
|---|---|
| news.newusers.questions | 1 |
| TOTAL: 1 | 1 |
INND Perl filter [Top 20]:
| Reason | Count |
|---|---|
| EMP (phn nph) | 60867 |
| EMP (phn path) | 59701 |
| EMP (phl) | 20685 |
| EMP (md5) | 2006 |
| Subject Rejected | 498 |
| Too many newsgroups | 233 |
| Too many newsgroups (meow) | 186 |
| HTML Multipart | 123 |
| MI5 Filter | 82 |
| Scoring filter | 27 |
| Too many newsgroups (low_xpost) | 15 |
| Binary Image: misplaced gif | 9 |
| Binary: misplaced binary | 3 |
| Binary Image: misplaced jpg | 2 |
| HTML post | 2 |
| hierarchy violation - crosspost outside sdnet | 2 |
| HTML file attachment | 1 |
| PFM bot misc | 1 |
| hierarchy violation - crosspost outside netscape | 1 |
| TOTAL: 19 | 144444 |
Miscellaneous innd statistics [Top 10]:
| Event | Server | Number |
|---|---|---|
| Bad Message-ID's offered | ||
| chimia.se | 7 | |
| TOTAL: 1 | 7 | |
| Including strange strings | ||
| chimia.se | 11 | |
| TOTAL: 1 | 11 | |
| TOTAL: 2 | 18 | |
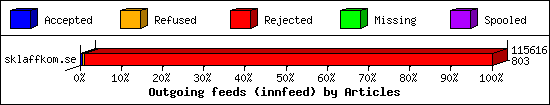
Outgoing Feeds (innfeed) by Articles:
| Server | Offered | Taken | Refused | Reject | Miss | Spool | %Took | Elapsed | |
|---|---|---|---|---|---|---|---|---|---|
| 1 | sklaffkom.se | 115616 | 803 | 520 | 114293 | 0 | 0 | 0% | 23:59:58 |
| 2 | sklaff.dev | 0 | 0 | 0 | 0 | 0 | 119270 | 0% | 23:57:42 |
| 3 | thebunker.nu | 0 | 0 | 0 | 0 | 0 | 119270 | 0% | 23:59:58 |
| 4 | usenet.blueworldhosting.com | 0 | 0 | 0 | 0 | 0 | 99135 | 0% | 23:59:58 |
| TOTAL: 4 | 115616 | 803 | 520 | 114293 | 0 | 337675 | 0% | 95:57:36 | |
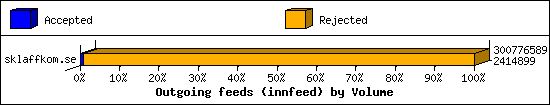
Outgoing Feeds (innfeed) by Volume:
| Server | AcceptVol | RejectVol | TotalVol | Volume/sec | Vol/Art | Elapsed | |
|---|---|---|---|---|---|---|---|
| 1 | sklaffkom.se | 2.3 MB | 284.5 MB | 286.8 MB | 3.4 KB/s | 2.6 KB | 23:59:58 |
| 2 | sklaff.dev | 0.0 KB | 0.0 KB | 0.0 KB | 0.0 KB/s | 0 | 23:57:42 |
| 3 | thebunker.nu | 0.0 KB | 0.0 KB | 0.0 KB | 0.0 KB/s | 0 | 23:59:58 |
| 4 | usenet.blueworldhosting.com | 0.0 KB | 0.0 KB | 0.0 KB | 0.0 KB/s | 0 | 23:59:58 |
| TOTAL: 4 | 2.3 MB | 284.5 MB | 286.8 MB | 0.9 KB/s | 2.6 KB | 95:57:36 | |
NNRP readership statistics:
| System | Conn | Arts | Size | Groups | Post | Rej | Elapsed | |
|---|---|---|---|---|---|---|---|---|
| 1 | n31.scanner.modat.io | 5 | 0 | 0.0 KB | 0 | 0 | 0 | 00:00:00 |
| 2 | 127.150.216.162.bc.googleusercontent.com | 2 | 0 | 0.0 KB | 0 | 0 | 0 | 00:00:06 |
| 3 | 241.210.203.35.bc.googleusercontent.com | 2 | 0 | 0.0 KB | 0 | 0 | 0 | 00:00:00 |
| 4 | azpdsg49032m.stretchoid.com | 2 | 0 | 0.0 KB | 0 | 0 | 0 | 00:00:10 |
| 5 | 147.185.132.212 | 1 | 0 | 0.0 KB | 0 | 0 | 0 | 00:00:00 |
| 6 | 198.235.24.236 | 1 | 0 | 0.0 KB | 0 | 0 | 0 | 00:00:00 |
| 7 | 205.210.31.208 | 1 | 0 | 0.0 KB | 0 | 0 | 0 | 00:00:00 |
| 8 | 237.210.203.35.bc.googleusercontent.com | 1 | 0 | 0.0 KB | 0 | 0 | 0 | 00:00:00 |
| 9 | 51.159.234.118 | 1 | 0 | 0.0 KB | 0 | 0 | 0 | 00:00:00 |
| 10 | 66.132.153.143 | 1 | 0 | 0.0 KB | 0 | 0 | 0 | 00:00:01 |
| 11 | anna.probe.onyphe.net | 1 | 0 | 0.0 KB | 0 | 0 | 0 | 00:00:03 |
| 12 | o306.scanner.modat.io | 1 | 0 | 0.0 KB | 0 | 0 | 0 | 00:00:00 |
| TOTAL: 12 | 19 | 0 | 0.0 KB | 0 | 0 | 0 | 00:00:23 | |
NNRP readership statistics (by domain):
| System | Conn | Arts | Size | Groups | Post | Rej | Elapsed | |
|---|---|---|---|---|---|---|---|---|
| 1 | *.scanner.modat.io | 6 | 0 | 0.0 KB | 0 | 0 | 0 | 00:00:00 |
| 2 | unresolved | 5 | 0 | 0.0 KB | 0 | 0 | 0 | 00:00:02 |
| 3 | *.210.203.35.bc.googleusercontent.com | 3 | 0 | 0.0 KB | 0 | 0 | 0 | 00:00:00 |
| 4 | *.150.216.162.bc.googleusercontent.com | 2 | 0 | 0.0 KB | 0 | 0 | 0 | 00:00:06 |
| 5 | *.stretchoid.com | 2 | 0 | 0.0 KB | 0 | 0 | 0 | 00:00:10 |
| 6 | *.probe.onyphe.net | 1 | 0 | 0.0 KB | 0 | 0 | 0 | 00:00:03 |
| TOTAL: 6 | 19 | 0 | 0.0 KB | 0 | 0 | 0 | 00:00:23 | |
NNRP total resource statistics [Top 20]:
| System | User(ms) | System(ms) | Idle(ms) | Elapsed |
|---|---|---|---|---|
| azpdsg49032m.stretchoid.com | 0.016 | 0.012 | 0.000 | 00:00:10 |
| 127.150.216.162.bc.googleusercontent.com | 0.082 | 0.008 | 0.000 | 00:00:06 |
| anna.probe.onyphe.net | 0.038 | 0.009 | 0.000 | 00:00:03 |
| 66.132.153.143 | 0.037 | 0.006 | 0.000 | 00:00:01 |
| 241.210.203.35.bc.googleusercontent.com | 0.080 | 0.009 | 0.000 | 00:00:00 |
| 205.210.31.208 | 0.007 | 0.005 | 0.000 | 00:00:00 |
| 147.185.132.212 | 0.042 | 0.004 | 0.000 | 00:00:00 |
| 237.210.203.35.bc.googleusercontent.com | 0.042 | 0.007 | 0.000 | 00:00:00 |
| n31.scanner.modat.io | 0.201 | 0.015 | 0.000 | 00:00:00 |
| 51.159.234.118 | 0.039 | 0.006 | 0.000 | 00:00:00 |
| 198.235.24.236 | 0.005 | 0.008 | 0.000 | 00:00:00 |
| o306.scanner.modat.io | 0.006 | 0.006 | 0.000 | 00:00:00 |
| TOTAL: 12 | 0.595 | 0.095 | 0.000 | 00:00:23 |
NNRP gethostbyaddr failures [Top 20]:
| System | Conn |
|---|---|
| ? (can't getpeername) | 9 |
| TOTAL: 1 | 9 |
NNRP unrecognized commands (by host) [Top 20]:
| System | Conn |
|---|---|
| 127.150.216.162.bc.googleusercontent.com | 4 |
| 147.185.132.212 | 4 |
| 237.210.203.35.bc.googleusercontent.com | 4 |
| 241.210.203.35.bc.googleusercontent.com | 4 |
| 66.132.153.143 | 1 |
| azpdsg49032m.stretchoid.com | 1 |
| n31.scanner.modat.io | 1 |
| TOTAL: 7 | 19 |
NNRP unrecognized commands (by command) [Top 20]:
| Command | Count |
|---|---|
| GET / HTTP/1.1 | 4 |
| Host: 109.238.130.155:563 | 4 |
| Accept-Encoding: gzip | 2 |
| Accept: */* | 2 |
| User-Agent: Hello from Palo Alto Network... | 2 |
| User-Agent: curl/7.68.0 | 2 |
| EHLO www.censys.io | 1 |
| HELO | 1 |
| MGLNDD_109.238.130.155_119 | 1 |
| TOTAL: 9 | 19 |
NNRP client timeouts [Top 20]:
| System | Conn | Peer |
|---|---|---|
| 127.150.216.162.bc.googleusercontent.com | 1 | 2 |
| 147.185.132.212 | 1 | 1 |
| 237.210.203.35.bc.googleusercontent.com | 1 | 1 |
| 241.210.203.35.bc.googleusercontent.com | 1 | 2 |
| n31.scanner.modat.io | 1 | 1 |
| TOTAL: 5 | 5 | 10 |