Unknown entries from news log file:
First 1 / 1 lines (100.0%)
Log entries by program:
| Program name | Lines | %Lines | Size | %Size |
|---|---|---|---|---|
| inn | 252599 | 59.8% | 30.8 MB | 63.5% |
| innd | 167546 | 39.6% | 17.4 MB | 35.9% |
| innfeed | 2400 | 0.6% | 262.9 KB | 0.5% |
| nnrpd | 186 | 0.0% | 19.5 KB | 0.0% |
| controlchan | 1 | 0.0% | 0.1 KB | 0.0% |
| TOTAL: 5 | 422732 | 100.0% | 48.5 MB | 100.0% |
History cache:
| Reason | Count | %Count |
|---|---|---|
| Do not exist | 252383 | 50.0% |
| Negative hits | 249023 | 49.3% |
| Cache misses | 3364 | 0.7% |
| Positive hits | 113 | 0.0% |
| TOTAL: 4 | 504883 | 100.0% |
INND timer:
| Code region | Time | Pct | Invoked | Min(ms) | Avg(ms) | Max(ms) |
|---|---|---|---|---|---|---|
| article cancel | 00:00:00.054 | 0.0% | 2 | 1.000 | 27.000 | 53.000 |
| article cleanup | 00:00:00.841 | 0.0% | 252666 | 0.000 | 0.003 | 0.137 |
| article logging | 00:00:03.902 | 0.0% | 252671 | 0.000 | 0.015 | 0.230 |
| article parse | 00:00:02.187 | 0.0% | 753470 | 0.000 | 0.003 | 0.019 |
| article write | 00:04:05.348 | 0.3% | 93797 | 0.000 | 2.616 | 22.333 |
| artlog/artparse | 00:00:00.000 | 0.0% | 0 | 0.000 | 0.000 | 0.000 |
| artlog/artwrite | 00:00:00.000 | 0.0% | 0 | 0.000 | 0.000 | 0.000 |
| data move | 00:00:00.250 | 0.0% | 760219 | 0.000 | 0.000 | 0.041 |
| hisgrep/artcncl | 00:00:00.001 | 0.0% | 2 | 0.000 | 0.500 | 1.000 |
| hishave/artparse | 00:00:00.000 | 0.0% | 0 | 0.000 | 0.000 | 0.000 |
| hissync/artwrite | 00:00:00.000 | 0.0% | 0 | 0.000 | 0.000 | 0.000 |
| history grep | 00:00:00.000 | 0.0% | 0 | 0.000 | 0.000 | 0.000 |
| history lookup | 00:11:36.447 | 0.8% | 505483 | 0.003 | 1.378 | 8.948 |
| history sync | 00:00:00.004 | 0.0% | 302 | 0.000 | 0.013 | 1.000 |
| history write | 00:05:18.964 | 0.4% | 252666 | 0.038 | 1.262 | 6.743 |
| hiswrite/artparse | 00:00:00.000 | 0.0% | 0 | 0.000 | 0.000 | 0.000 |
| idle | 23:32:56.653 | 98.1% | 757416 | 35.867 | 111.929 | 60020.000 |
| nntp read | 00:00:05.292 | 0.0% | 757232 | 0.000 | 0.007 | 0.149 |
| overview write | 00:00:19.290 | 0.0% | 93797 | 0.000 | 0.206 | 12.517 |
| perl filter | 00:04:57.850 | 0.3% | 252666 | 0.411 | 1.179 | 5.621 |
| python filter | 00:00:13.220 | 0.0% | 505183 | 0.000 | 0.026 | 0.378 |
| site send | 00:00:00.890 | 0.0% | 93797 | 0.000 | 0.009 | 0.100 |
| TOTAL: 24:00:17.772 | 23:59:41.193 | 100.0% | - | - | - | - |
INNfeed timer:
| Code region | Time | Pct | Invoked | Min(ms) | Avg(ms) | Max(ms) |
|---|---|---|---|---|---|---|
| article new | 00:00:00.139 | 0.0% | 93762 | 0.000 | 0.001 | 0.035 |
| article prepare | 00:00:00.026 | 0.0% | 358140 | 0.000 | 0.000 | 0.007 |
| article read | 00:00:08.093 | 0.0% | 89535 | 0.000 | 0.090 | 1.800 |
| backlog stats | 00:00:00.100 | 0.0% | 458063 | 0.000 | 0.000 | 0.007 |
| callbacks | 00:00:00.000 | 0.0% | 0 | 0.000 | 0.000 | 0.000 |
| data read | 00:00:01.761 | 0.0% | 273465 | 0.000 | 0.006 | 0.050 |
| data write | 00:00:02.707 | 0.0% | 179769 | 0.000 | 0.015 | 0.076 |
| idle | 23:59:28.761 | 100.0% | 458063 | 54.335 | 188.552 | 8279.333 |
| status file | 00:00:00.077 | 0.0% | 197 | 0.000 | 0.391 | 12.500 |
| TOTAL: 23:59:46.162 | 23:59:41.664 | 100.0% | - | - | - | - |
nnrpd timer:
| Code region | Time | Pct | Invoked | Min(ms) | Avg(ms) | Max(ms) |
|---|---|---|---|---|---|---|
| idle | 00:00:15.076 | 12.8% | 13 | 34.000 | 1159.692 | 3941.000 |
| newnews | 00:00:00.000 | 0.0% | 0 | 0.000 | 0.000 | 0.000 |
| nntpwrite | 00:00:00.000 | 0.0% | 115 | 0.000 | 0.000 | 0.000 |
| TOTAL: 00:01:57.337 | 00:00:15.076 | 12.8% | - | - | - | - |
Control commands to INND:
| Command | Number |
|---|---|
| flush | 2 |
| flushlogs | 2 |
| go | 2 |
| logmode | 2 |
| lowmark | 1 |
| mode | 145 |
| name | 2 |
| pause | 2 |
| paused | 2 |
| reload | 2 |
| reserve | 2 |
| TOTAL: 11 | 164 |
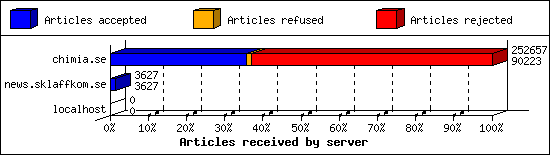
Incoming Feeds (INN):
| Server | Connects | Offered | Taken | Refused | Reject | %Accpt | Elapsed | |
|---|---|---|---|---|---|---|---|---|
| 1 | chimia.se | 2 | 252657 | 90223 | 3492 | 158942 | 35% | 23:55:48 |
| 2 | news.sklaffkom.se | 2 | 3627 | 3627 | 0 | 0 | 100% | 23:58:37 |
| 3 | localhost | 25 | 0 | 0 | 0 | 0 | 0% | 00:00:00 |
| TOTAL: 3 | 29 | 256284 | 93850 | 3492 | 158942 | 36% | 47:54:25 | |
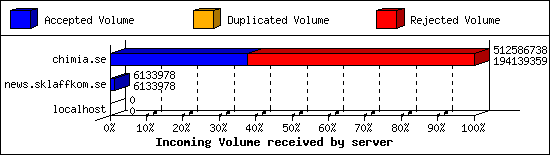
Incoming Volume (INN):
| Server | AcceptVol | DupVol | RejVol | TotalVol | %Acc | Vol/Art | |
|---|---|---|---|---|---|---|---|
| 1 | chimia.se | 185.1 MB | 0.0 KB | 303.7 MB | 488.8 MB | 37% | 2.0 KB |
| 2 | news.sklaffkom.se | 5.8 MB | 0.0 KB | 0.0 KB | 5.8 MB | 100% | 1.7 KB |
| 3 | localhost | 0.0 KB | 0.0 KB | 0.0 KB | 0.0 KB | 0% | 0 |
| TOTAL: 3 | 191.0 MB | 0.0 KB | 303.7 MB | 494.7 MB | 38% | 2.0 KB | |
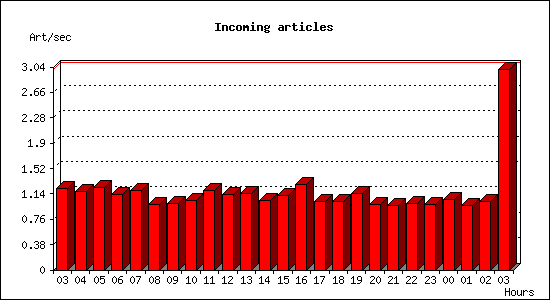
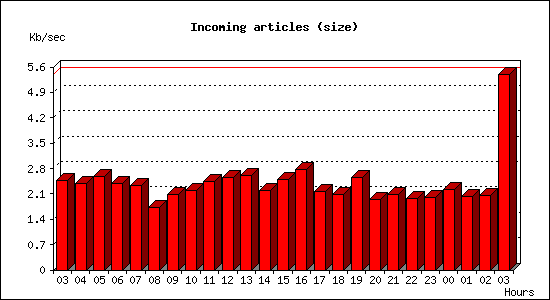
Incoming articles:
| Date | Articles | %Arts | Art/sec | Size | %Size | KB/sec |
|---|---|---|---|---|---|---|
| Jan 18 03:00:01 - 03:59:59 | 4418 | 4.7% | 1.23 | 8.7 MB | 4.6% | 2.48 |
| Jan 18 04:00:00 - 04:59:59 | 4214 | 4.5% | 1.17 | 8.4 MB | 4.4% | 2.39 |
| Jan 18 05:00:00 - 05:59:59 | 4461 | 4.8% | 1.24 | 9.1 MB | 4.7% | 2.58 |
| Jan 18 06:00:00 - 06:59:59 | 4078 | 4.3% | 1.13 | 8.3 MB | 4.4% | 2.37 |
| Jan 18 07:00:00 - 07:59:59 | 4305 | 4.6% | 1.20 | 8.2 MB | 4.3% | 2.34 |
| Jan 18 08:00:00 - 08:59:59 | 3529 | 3.8% | 0.98 | 6.1 MB | 3.2% | 1.73 |
| Jan 18 09:00:00 - 09:59:59 | 3592 | 3.8% | 1.00 | 7.3 MB | 3.8% | 2.08 |
| Jan 18 10:00:00 - 10:59:59 | 3745 | 4.0% | 1.04 | 7.7 MB | 4.1% | 2.20 |
| Jan 18 11:00:00 - 11:59:59 | 4312 | 4.6% | 1.20 | 8.6 MB | 4.5% | 2.44 |
| Jan 18 12:00:00 - 12:59:59 | 4089 | 4.4% | 1.14 | 9.0 MB | 4.7% | 2.56 |
| Jan 18 13:00:00 - 13:59:59 | 4100 | 4.4% | 1.14 | 9.2 MB | 4.8% | 2.61 |
| Jan 18 14:00:00 - 14:59:59 | 3749 | 4.0% | 1.04 | 7.7 MB | 4.0% | 2.18 |
| Jan 18 15:00:00 - 15:59:59 | 4018 | 4.3% | 1.12 | 8.8 MB | 4.6% | 2.49 |
| Jan 18 16:00:00 - 16:59:59 | 4583 | 4.9% | 1.27 | 9.7 MB | 5.1% | 2.77 |
| Jan 18 17:00:00 - 17:59:59 | 3698 | 3.9% | 1.03 | 7.6 MB | 4.0% | 2.16 |
| Jan 18 18:00:00 - 18:59:59 | 3687 | 3.9% | 1.02 | 7.3 MB | 3.8% | 2.08 |
| Jan 18 19:00:00 - 19:59:59 | 4105 | 4.4% | 1.14 | 9.0 MB | 4.7% | 2.55 |
| Jan 18 20:00:00 - 20:59:59 | 3552 | 3.8% | 0.99 | 6.8 MB | 3.6% | 1.94 |
| Jan 18 21:00:00 - 21:59:59 | 3463 | 3.7% | 0.96 | 7.3 MB | 3.8% | 2.08 |
| Jan 18 22:00:00 - 22:59:59 | 3585 | 3.8% | 1.00 | 6.9 MB | 3.6% | 1.97 |
| Jan 18 23:00:00 - 23:59:59 | 3537 | 3.8% | 0.98 | 7.0 MB | 3.7% | 1.99 |
| Jan 19 00:00:00 - 00:59:59 | 3802 | 4.1% | 1.06 | 7.8 MB | 4.1% | 2.22 |
| Jan 19 01:00:00 - 01:59:59 | 3473 | 3.7% | 0.96 | 7.2 MB | 3.8% | 2.04 |
| Jan 19 02:00:00 - 02:59:59 | 3681 | 3.9% | 1.02 | 7.2 MB | 3.8% | 2.06 |
| Jan 19 03:00:00 - 03:00:01 | 3 | 0.0% | 3.00 | 5.4 KB | 0.0% | 5.41 |
| TOTAL: 24:00:00 | 93779 | 100.0% | 1.09 | 190.9 MB | 100.0% | 2.26 |
Sites sending bad articles:
| Server | Total | Group | Dist | Duplic | Unapp | TooOld | Site | Line | Other | |
|---|---|---|---|---|---|---|---|---|---|---|
| 1 | chimia.se | 158820 | 0 | 0 | 0 | 0 | 0 | 0 | 0 | 158820 |
| TOTAL: 1 | 158820 | 0 | 0 | 0 | 0 | 0 | 0 | 0 | 158820 | |
INND Perl filter [Top 20]:
| Reason | Count |
|---|---|
| EMP (phn path) | 75208 |
| EMP (phn nph) | 53075 |
| EMP (phl) | 29734 |
| EMP (md5) | 376 |
| Too many newsgroups (meow) | 346 |
| HTML Multipart | 37 |
| Scoring filter | 13 |
| Too many newsgroups (low_xpost) | 11 |
| Poison newsgroup | 7 |
| Binary Image: misplaced gif | 3 |
| HTML post | 2 |
| Binary: misplaced binary | 1 |
| HTML Image Tags | 1 |
| Malformed article | 1 |
| TOTAL: 14 | 158815 |
Miscellaneous innd statistics [Top 10]:
| Event | Server | Number |
|---|---|---|
| Bad Message-ID's offered | ||
| chimia.se | 3 | |
| TOTAL: 1 | 3 | |
| Including strange strings | ||
| chimia.se | 5 | |
| TOTAL: 1 | 5 | |
| TOTAL: 2 | 8 | |
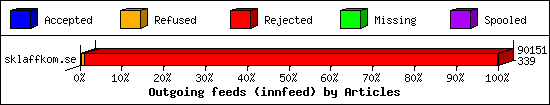
Outgoing Feeds (innfeed) by Articles:
| Server | Offered | Taken | Refused | Reject | Miss | Spool | %Took | Elapsed | |
|---|---|---|---|---|---|---|---|---|---|
| 1 | sklaffkom.se | 90151 | 339 | 599 | 89213 | 0 | 0 | 0% | 23:59:57 |
| 2 | sklaff.dev | 0 | 0 | 0 | 0 | 0 | 93778 | 0% | 23:57:45 |
| 3 | thebunker.nu | 0 | 0 | 0 | 0 | 0 | 93778 | 0% | 23:59:57 |
| 4 | usenet.blueworldhosting.com | 0 | 0 | 0 | 0 | 0 | 93211 | 0% | 23:59:57 |
| TOTAL: 4 | 90151 | 339 | 599 | 89213 | 0 | 280767 | 0% | 95:57:36 | |
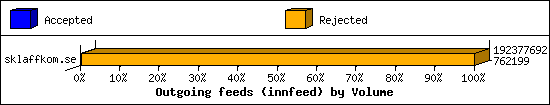
Outgoing Feeds (innfeed) by Volume:
| Server | AcceptVol | RejectVol | TotalVol | Volume/sec | Vol/Art | Elapsed | |
|---|---|---|---|---|---|---|---|
| 1 | sklaffkom.se | 744.3 KB | 182.7 MB | 183.5 MB | 2.2 KB/s | 2.1 KB | 23:59:57 |
| 2 | sklaff.dev | 0.0 KB | 0.0 KB | 0.0 KB | 0.0 KB/s | 0 | 23:57:45 |
| 3 | thebunker.nu | 0.0 KB | 0.0 KB | 0.0 KB | 0.0 KB/s | 0 | 23:59:57 |
| 4 | usenet.blueworldhosting.com | 0.0 KB | 0.0 KB | 0.0 KB | 0.0 KB/s | 0 | 23:59:57 |
| TOTAL: 4 | 744.3 KB | 182.7 MB | 183.5 MB | 0.5 KB/s | 2.1 KB | 95:57:36 | |
NNRP readership statistics:
| System | Conn | Arts | Size | Groups | Post | Rej | Elapsed | |
|---|---|---|---|---|---|---|---|---|
| 1 | o310.scanner.modat.io | 6 | 0 | 0.0 KB | 0 | 0 | 0 | 00:00:00 |
| 2 | 164.149.216.162.bc.googleusercontent.com | 4 | 0 | 0.0 KB | 0 | 0 | 0 | 00:01:15 |
| 3 | 147.185.132.251 | 2 | 0 | 0.0 KB | 0 | 0 | 0 | 00:00:12 |
| 4 | 147.185.133.33 | 1 | 0 | 0.0 KB | 0 | 0 | 0 | 00:00:05 |
| 5 | 162.142.125.112 | 1 | 0 | 0.0 KB | 0 | 0 | 0 | 00:00:00 |
| 6 | 176.65.148.95.ptr.pfcloud.network | 1 | 0 | 0.0 KB | 0 | 0 | 0 | 00:00:00 |
| 7 | 192.227.206.227 | 1 | 0 | 0.0 KB | 0 | 0 | 0 | 00:00:00 |
| 8 | 205.210.31.249 | 1 | 0 | 0.0 KB | 0 | 0 | 0 | 00:00:03 |
| 9 | 205.210.31.85 | 1 | 0 | 0.0 KB | 0 | 0 | 0 | 00:00:01 |
| 10 | 51.159.234.118 | 1 | 0 | 0.0 KB | 0 | 0 | 0 | 00:00:00 |
| 11 | 93.211.203.35.bc.googleusercontent.com | 1 | 0 | 0.0 KB | 0 | 0 | 0 | 00:00:00 |
| 12 | annalise.probe.onyphe.net | 1 | 0 | 0.0 KB | 0 | 0 | 0 | 00:00:00 |
| 13 | astounding.monitoring.internet-measurement.com | 1 | 0 | 0.0 KB | 0 | 0 | 0 | 00:00:01 |
| 14 | beneficial.monitoring.internet-measurement.com | 1 | 0 | 0.0 KB | 0 | 0 | 0 | 00:00:03 |
| 15 | celebrated.monitoring.internet-measurement.com | 1 | 0 | 0.0 KB | 0 | 0 | 0 | 00:00:00 |
| 16 | charitable.monitoring.internet-measurement.com | 1 | 0 | 0.0 KB | 0 | 0 | 0 | 00:00:00 |
| 17 | enthusiastic.monitoring.internet-measurement.com | 1 | 0 | 0.0 KB | 0 | 0 | 0 | 00:00:03 |
| 18 | medina.probe.onyphe.net | 1 | 0 | 0.0 KB | 0 | 0 | 0 | 00:00:03 |
| 19 | realized.monitoring.internet-measurement.com | 1 | 0 | 0.0 KB | 0 | 0 | 0 | 00:00:00 |
| 20 | renowned.monitoring.internet-measurement.com | 1 | 0 | 0.0 KB | 0 | 0 | 0 | 00:00:00 |
| 21 | stefan.probe.onyphe.net | 1 | 0 | 0.0 KB | 0 | 0 | 0 | 00:00:03 |
| 22 | wonderful.monitoring.internet-measurement.com | 1 | 0 | 0.0 KB | 0 | 0 | 0 | 00:00:00 |
| 23 | zahida.probe.onyphe.net | 1 | 0 | 0.0 KB | 0 | 0 | 0 | 00:00:01 |
| TOTAL: 23 | 32 | 0 | 0.0 KB | 0 | 0 | 0 | 00:01:57 | |
NNRP readership statistics (by domain):
| System | Conn | Arts | Size | Groups | Post | Rej | Elapsed | |
|---|---|---|---|---|---|---|---|---|
| 1 | *.monitoring.internet-measurement.com | 8 | 0 | 0.0 KB | 0 | 0 | 0 | 00:00:08 |
| 2 | unresolved | 8 | 0 | 0.0 KB | 0 | 0 | 0 | 00:00:24 |
| 3 | *.scanner.modat.io | 6 | 0 | 0.0 KB | 0 | 0 | 0 | 00:00:00 |
| 4 | *.149.216.162.bc.googleusercontent.com | 4 | 0 | 0.0 KB | 0 | 0 | 0 | 00:01:15 |
| 5 | *.probe.onyphe.net | 4 | 0 | 0.0 KB | 0 | 0 | 0 | 00:00:07 |
| 6 | *.211.203.35.bc.googleusercontent.com | 1 | 0 | 0.0 KB | 0 | 0 | 0 | 00:00:00 |
| 7 | *.65.148.95.ptr.pfcloud.network | 1 | 0 | 0.0 KB | 0 | 0 | 0 | 00:00:00 |
| TOTAL: 7 | 32 | 0 | 0.0 KB | 0 | 0 | 0 | 00:01:57 | |
NNRP total resource statistics [Top 20]:
| System | User(ms) | System(ms) | Idle(ms) | Elapsed |
|---|---|---|---|---|
| 164.149.216.162.bc.googleusercontent.com | 0.161 | 0.022 | 0.000 | 00:01:15 |
| 147.185.132.251 | 0.082 | 0.011 | 0.000 | 00:00:12 |
| 147.185.133.33 | 0.041 | 0.007 | 0.000 | 00:00:05 |
| 205.210.31.249 | 0.002 | 0.010 | 0.000 | 00:00:03 |
| medina.probe.onyphe.net | 0.009 | 0.002 | 0.000 | 00:00:03 |
| beneficial.monitoring.internet-measurement.com | 0.040 | 0.006 | 0.000 | 00:00:03 |
| enthusiastic.monitoring.internet-measurement.com | 0.038 | 0.005 | 0.000 | 00:00:03 |
| stefan.probe.onyphe.net | 0.008 | 0.003 | 0.000 | 00:00:03 |
| astounding.monitoring.internet-measurement.com | 0.006 | 0.009 | 0.000 | 00:00:01 |
| 205.210.31.85 | 0.006 | 0.007 | 0.000 | 00:00:01 |
| zahida.probe.onyphe.net | 0.008 | 0.004 | 0.000 | 00:00:01 |
| 192.227.206.227 | 0.010 | 0.005 | 0.000 | 00:00:00 |
| 162.142.125.112 | 0.041 | 0.007 | 0.000 | 00:00:00 |
| o310.scanner.modat.io | 0.205 | 0.027 | 0.000 | 00:00:00 |
| annalise.probe.onyphe.net | 0.008 | 0.004 | 0.000 | 00:00:00 |
| 93.211.203.35.bc.googleusercontent.com | 0.038 | 0.009 | 0.000 | 00:00:00 |
| 176.65.148.95.ptr.pfcloud.network | 0.038 | 0.005 | 0.000 | 00:00:00 |
| charitable.monitoring.internet-measurement.com | 0.040 | 0.005 | 0.000 | 00:00:00 |
| 51.159.234.118 | 0.039 | 0.003 | 0.000 | 00:00:00 |
| celebrated.monitoring.internet-measurement.com | 0.039 | 0.005 | 0.000 | 00:00:00 |
| TOTAL: 20 | 0.859 | 0.156 | 0.000 | 00:01:57 |
NNRP gethostbyaddr failures [Top 20]:
| System | Conn |
|---|---|
| ? (can't getpeername) | 14 |
| TOTAL: 1 | 14 |
NNRP unrecognized commands (by host) [Top 20]:
| System | Conn |
|---|---|
| 164.149.216.162.bc.googleusercontent.com | 8 |
| 147.185.132.251 | 4 |
| 147.185.133.33 | 4 |
| 93.211.203.35.bc.googleusercontent.com | 4 |
| zahida.probe.onyphe.net | 4 |
| annalise.probe.onyphe.net | 2 |
| 162.142.125.112 | 1 |
| o310.scanner.modat.io | 1 |
| TOTAL: 8 | 28 |
NNRP unrecognized commands (by command) [Top 20]:
| Command | Count |
|---|---|
| GET / HTTP/1.1 | 5 |
| Host: 109.238.130.155:563 | 5 |
| Accept: */* | 3 |
| User-Agent: curl/7.68.0 | 3 |
| #026#003#003#001¨#001 | 2 |
| Accept-Encoding: gzip | 2 |
| User-Agent: Hello from Palo Alto Network... | 2 |
| À$ÀÀ¯À,ÀrÀsÌ©#023#002#023#001Ì#024À#007À#022À#023À'À/À#024À(À0À`Àa... | 2 |
| EHLO www.censys.io | 1 |
| HELO | 1 |
| æÔôÄÁ#037#003ÊçcäÃÑàýÛ÷œ#035 | 1 |
| ñ‘æËcg>¬ | 1 |
| TOTAL: 12 | 28 |
NNRP client timeouts [Top 20]:
| System | Conn | Peer |
|---|---|---|
| 164.149.216.162.bc.googleusercontent.com | 2 | 4 |
| 147.185.132.251 | 1 | 2 |
| 147.185.133.33 | 1 | 1 |
| 93.211.203.35.bc.googleusercontent.com | 1 | 1 |
| o310.scanner.modat.io | 1 | 1 |
| TOTAL: 5 | 6 | 12 |