Unknown entries from news log file:
First 1 / 1 lines (100.0%)
Log entries by program:
| Program name | Lines | %Lines | Size | %Size |
|---|---|---|---|---|
| inn | 258955 | 59.7% | 32.0 MB | 63.5% |
| innd | 172618 | 39.8% | 18.2 MB | 36.0% |
| innfeed | 2381 | 0.5% | 263.3 KB | 0.5% |
| nnrpd | 163 | 0.0% | 16.6 KB | 0.0% |
| controlchan | 1 | 0.0% | 0.1 KB | 0.0% |
| TOTAL: 5 | 434118 | 100.0% | 50.5 MB | 100.0% |
History cache:
| Reason | Count | %Count |
|---|---|---|
| Do not exist | 258736 | 49.9% |
| Negative hits | 255446 | 49.2% |
| Cache misses | 4425 | 0.9% |
| Positive hits | 81 | 0.0% |
| TOTAL: 4 | 518688 | 100.0% |
INND timer:
| Code region | Time | Pct | Invoked | Min(ms) | Avg(ms) | Max(ms) |
|---|---|---|---|---|---|---|
| article cancel | 00:00:00.093 | 0.0% | 6 | 0.000 | 15.500 | 60.000 |
| article cleanup | 00:00:01.160 | 0.0% | 258957 | 0.000 | 0.004 | 0.166 |
| article logging | 00:00:03.674 | 0.0% | 258957 | 0.000 | 0.014 | 0.599 |
| article parse | 00:00:02.437 | 0.0% | 773177 | 0.000 | 0.003 | 0.017 |
| article write | 00:04:04.498 | 0.3% | 95081 | 0.000 | 2.571 | 55.606 |
| artlog/artparse | 00:00:00.000 | 0.0% | 0 | 0.000 | 0.000 | 0.000 |
| artlog/artwrite | 00:00:00.000 | 0.0% | 0 | 0.000 | 0.000 | 0.000 |
| data move | 00:00:00.273 | 0.0% | 783744 | 0.000 | 0.000 | 0.017 |
| hisgrep/artcncl | 00:00:00.001 | 0.0% | 6 | 0.000 | 0.167 | 1.000 |
| hishave/artparse | 00:00:00.000 | 0.0% | 0 | 0.000 | 0.000 | 0.000 |
| hissync/artwrite | 00:00:00.000 | 0.0% | 0 | 0.000 | 0.000 | 0.000 |
| history grep | 00:00:00.000 | 0.0% | 0 | 0.000 | 0.000 | 0.000 |
| history lookup | 00:09:53.944 | 0.7% | 519167 | 0.000 | 1.144 | 8.961 |
| history sync | 00:00:00.010 | 0.0% | 300 | 0.000 | 0.033 | 3.000 |
| history write | 00:05:30.101 | 0.4% | 258954 | 0.000 | 1.275 | 7.857 |
| hiswrite/artparse | 00:00:00.000 | 0.0% | 0 | 0.000 | 0.000 | 0.000 |
| idle | 23:33:58.547 | 98.2% | 778152 | 49.850 | 109.026 | 60059.000 |
| nntp read | 00:00:06.099 | 0.0% | 777963 | 0.000 | 0.008 | 0.150 |
| overview write | 00:00:24.341 | 0.0% | 95081 | 0.000 | 0.256 | 6.224 |
| perl filter | 00:05:10.917 | 0.4% | 258954 | 0.399 | 1.201 | 52.000 |
| python filter | 00:00:13.337 | 0.0% | 518864 | 0.000 | 0.026 | 0.365 |
| site send | 00:00:00.835 | 0.0% | 95081 | 0.000 | 0.009 | 0.083 |
| TOTAL: 24:00:07.385 | 23:59:30.267 | 100.0% | - | - | - | - |
INNfeed timer:
| Code region | Time | Pct | Invoked | Min(ms) | Avg(ms) | Max(ms) |
|---|---|---|---|---|---|---|
| article new | 00:00:00.114 | 0.0% | 95049 | 0.000 | 0.001 | 0.038 |
| article prepare | 00:00:00.023 | 0.0% | 362720 | 0.000 | 0.000 | 0.006 |
| article read | 00:00:06.926 | 0.0% | 90680 | 0.000 | 0.076 | 33.500 |
| backlog stats | 00:00:00.102 | 0.0% | 464341 | 0.000 | 0.000 | 0.008 |
| callbacks | 00:00:00.000 | 0.0% | 0 | 0.000 | 0.000 | 0.000 |
| data read | 00:00:01.773 | 0.0% | 277249 | 0.000 | 0.006 | 0.083 |
| data write | 00:00:02.748 | 0.0% | 182262 | 0.000 | 0.015 | 0.167 |
| idle | 23:59:26.382 | 100.0% | 464341 | 50.303 | 185.998 | 15017.750 |
| status file | 00:00:00.288 | 0.0% | 197 | 0.000 | 1.462 | 58.333 |
| TOTAL: 23:59:42.876 | 23:59:38.356 | 100.0% | - | - | - | - |
nnrpd timer:
| Code region | Time | Pct | Invoked | Min(ms) | Avg(ms) | Max(ms) |
|---|---|---|---|---|---|---|
| idle | 00:00:30.796 | 40.3% | 20 | 23.000 | 1539.800 | 10050.000 |
| newnews | 00:00:00.000 | 0.0% | 0 | 0.000 | 0.000 | 0.000 |
| nntpwrite | 00:00:00.001 | 0.0% | 188 | 0.000 | 0.005 | 0.091 |
| TOTAL: 00:01:16.407 | 00:00:30.797 | 40.3% | - | - | - | - |
Control commands to INND:
| Command | Number |
|---|---|
| go | 2 |
| logmode | 1 |
| lowmark | 1 |
| mode | 144 |
| name | 1 |
| pause | 1 |
| paused | 1 |
| reload | 2 |
| reserve | 2 |
| TOTAL: 9 | 155 |
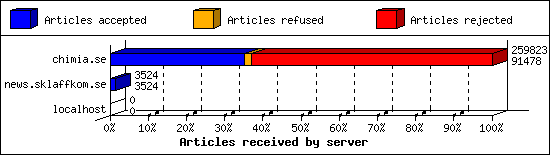
Incoming Feeds (INN):
| Server | Connects | Offered | Taken | Refused | Reject | %Accpt | Elapsed | |
|---|---|---|---|---|---|---|---|---|
| 1 | chimia.se | 2 | 259823 | 91478 | 4503 | 163842 | 35% | 23:53:43 |
| 2 | news.sklaffkom.se | 2 | 3524 | 3524 | 0 | 0 | 100% | 23:43:05 |
| 3 | localhost | 25 | 0 | 0 | 0 | 0 | 0% | 00:00:00 |
| TOTAL: 3 | 29 | 263347 | 95002 | 4503 | 163842 | 36% | 47:36:48 | |
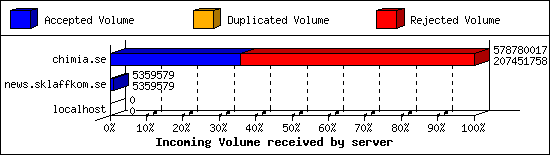
Incoming Volume (INN):
| Server | AcceptVol | DupVol | RejVol | TotalVol | %Acc | Vol/Art | |
|---|---|---|---|---|---|---|---|
| 1 | chimia.se | 197.8 MB | 12.5 KB | 354.1 MB | 552.0 MB | 35% | 2.2 KB |
| 2 | news.sklaffkom.se | 5.1 MB | 0.0 KB | 0.0 KB | 5.1 MB | 100% | 1.5 KB |
| 3 | localhost | 0.0 KB | 0.0 KB | 0.0 KB | 0.0 KB | 0% | 0 |
| TOTAL: 3 | 203.0 MB | 12.5 KB | 354.1 MB | 557.1 MB | 36% | 2.2 KB | |
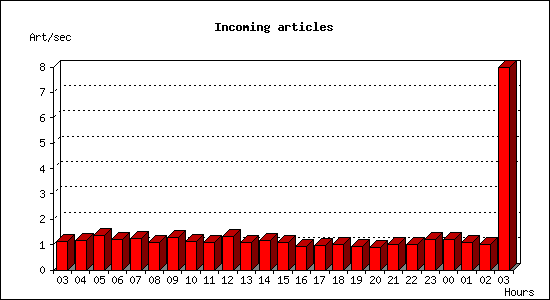
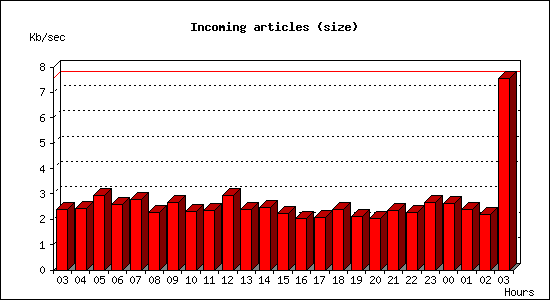
Incoming articles:
| Date | Articles | %Arts | Art/sec | Size | %Size | KB/sec |
|---|---|---|---|---|---|---|
| Jan 19 03:00:01 - 03:59:59 | 3998 | 4.2% | 1.11 | 8.3 MB | 4.1% | 2.37 |
| Jan 19 04:00:00 - 04:59:59 | 4194 | 4.4% | 1.17 | 8.5 MB | 4.2% | 2.43 |
| Jan 19 05:00:00 - 05:59:59 | 4881 | 5.1% | 1.36 | 10.4 MB | 5.1% | 2.94 |
| Jan 19 06:00:00 - 06:59:59 | 4309 | 4.5% | 1.20 | 9.1 MB | 4.5% | 2.60 |
| Jan 19 07:00:00 - 07:59:59 | 4421 | 4.7% | 1.23 | 9.7 MB | 4.8% | 2.77 |
| Jan 19 08:00:00 - 08:59:59 | 3835 | 4.0% | 1.07 | 7.9 MB | 3.9% | 2.26 |
| Jan 19 09:00:00 - 09:59:59 | 4604 | 4.8% | 1.28 | 9.4 MB | 4.6% | 2.67 |
| Jan 19 10:00:00 - 10:59:59 | 4106 | 4.3% | 1.14 | 8.1 MB | 4.0% | 2.29 |
| Jan 19 11:00:00 - 11:59:59 | 3889 | 4.1% | 1.08 | 8.2 MB | 4.0% | 2.33 |
| Jan 19 12:00:00 - 12:59:59 | 4722 | 5.0% | 1.31 | 10.3 MB | 5.1% | 2.94 |
| Jan 19 13:00:00 - 13:59:59 | 3839 | 4.0% | 1.07 | 8.3 MB | 4.1% | 2.37 |
| Jan 19 14:00:00 - 14:59:59 | 4199 | 4.4% | 1.17 | 8.7 MB | 4.3% | 2.47 |
| Jan 19 15:00:00 - 15:59:59 | 3883 | 4.1% | 1.08 | 7.8 MB | 3.9% | 2.22 |
| Jan 19 16:00:00 - 16:59:59 | 3276 | 3.4% | 0.91 | 7.2 MB | 3.5% | 2.05 |
| Jan 19 17:00:00 - 17:59:59 | 3410 | 3.6% | 0.95 | 7.3 MB | 3.6% | 2.08 |
| Jan 19 18:00:00 - 18:59:59 | 3551 | 3.7% | 0.99 | 8.4 MB | 4.1% | 2.38 |
| Jan 19 19:00:00 - 19:59:59 | 3346 | 3.5% | 0.93 | 7.4 MB | 3.6% | 2.10 |
| Jan 19 20:00:00 - 20:59:59 | 3224 | 3.4% | 0.90 | 7.1 MB | 3.5% | 2.02 |
| Jan 19 21:00:00 - 21:59:59 | 3558 | 3.7% | 0.99 | 8.3 MB | 4.1% | 2.35 |
| Jan 19 22:00:00 - 22:59:59 | 3588 | 3.8% | 1.00 | 7.9 MB | 3.9% | 2.26 |
| Jan 19 23:00:00 - 23:59:59 | 4365 | 4.6% | 1.21 | 9.4 MB | 4.6% | 2.68 |
| Jan 20 00:00:00 - 00:59:59 | 4384 | 4.6% | 1.22 | 9.2 MB | 4.5% | 2.61 |
| Jan 20 01:00:00 - 01:59:59 | 3867 | 4.1% | 1.07 | 8.4 MB | 4.1% | 2.39 |
| Jan 20 02:00:00 - 02:59:59 | 3614 | 3.8% | 1.00 | 7.6 MB | 3.8% | 2.18 |
| Jan 20 03:00:00 - 03:00:01 | 8 | 0.0% | 8.00 | 7.6 KB | 0.0% | 7.57 |
| TOTAL: 24:00:00 | 95071 | 100.0% | 1.10 | 203.0 MB | 100.0% | 2.41 |
Sites sending bad articles:
| Server | Total | Group | Dist | Duplic | Unapp | TooOld | Site | Line | Other | |
|---|---|---|---|---|---|---|---|---|---|---|
| 1 | chimia.se | 163884 | 0 | 0 | 3 | 0 | 0 | 0 | 0 | 163881 |
| TOTAL: 1 | 163884 | 0 | 0 | 3 | 0 | 0 | 0 | 0 | 163881 | |
INND Perl filter [Top 20]:
| Reason | Count |
|---|---|
| EMP (phn path) | 63851 |
| EMP (phn nph) | 59844 |
| EMP (phl) | 39199 |
| Too many newsgroups (meow) | 409 |
| EMP (md5) | 387 |
| HTML Image Tags | 82 |
| HTML Multipart | 80 |
| Scoring filter | 12 |
| HTML post | 7 |
| Subject Rejected | 5 |
| Too many newsgroups (low_xpost) | 3 |
| Poison newsgroup | 1 |
| TOTAL: 12 | 163880 |
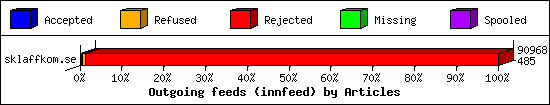
Outgoing Feeds (innfeed) by Articles:
| Server | Offered | Taken | Refused | Reject | Miss | Spool | %Took | Elapsed | |
|---|---|---|---|---|---|---|---|---|---|
| 1 | sklaffkom.se | 90968 | 485 | 806 | 89677 | 0 | 0 | 0% | 23:50:00 |
| 2 | sklaff.dev | 0 | 0 | 0 | 0 | 0 | 94636 | 0% | 23:50:01 |
| 3 | thebunker.nu | 0 | 0 | 0 | 0 | 0 | 94512 | 0% | 23:50:00 |
| 4 | usenet.blueworldhosting.com | 0 | 0 | 0 | 0 | 0 | 93916 | 0% | 23:50:00 |
| TOTAL: 4 | 90968 | 485 | 806 | 89677 | 0 | 283064 | 0% | 95:20:01 | |
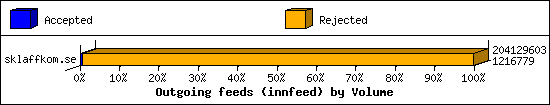
Outgoing Feeds (innfeed) by Volume:
| Server | AcceptVol | RejectVol | TotalVol | Volume/sec | Vol/Art | Elapsed | |
|---|---|---|---|---|---|---|---|
| 1 | sklaffkom.se | 1.2 MB | 193.5 MB | 194.7 MB | 2.3 KB/s | 2.2 KB | 23:50:00 |
| 2 | sklaff.dev | 0.0 KB | 0.0 KB | 0.0 KB | 0.0 KB/s | 0 | 23:50:01 |
| 3 | thebunker.nu | 0.0 KB | 0.0 KB | 0.0 KB | 0.0 KB/s | 0 | 23:50:00 |
| 4 | usenet.blueworldhosting.com | 0.0 KB | 0.0 KB | 0.0 KB | 0.0 KB/s | 0 | 23:50:00 |
| TOTAL: 4 | 1.2 MB | 193.5 MB | 194.7 MB | 0.6 KB/s | 2.2 KB | 95:20:01 | |
NNRP readership statistics:
| System | Conn | Arts | Size | Groups | Post | Rej | Elapsed | |
|---|---|---|---|---|---|---|---|---|
| 1 | o312.scanner.modat.io | 5 | 0 | 0.0 KB | 0 | 0 | 0 | 00:00:00 |
| 2 | 162.142.125.37 | 3 | 0 | 0.0 KB | 0 | 0 | 0 | 00:00:03 |
| 3 | 167.94.146.61 | 3 | 0 | 0.0 KB | 0 | 0 | 0 | 00:00:03 |
| 4 | 38.150.216.162.bc.googleusercontent.com | 2 | 0 | 0.0 KB | 0 | 0 | 0 | 00:00:13 |
| 5 | 48.211.203.35.bc.googleusercontent.com | 2 | 0 | 0.0 KB | 0 | 0 | 0 | 00:00:27 |
| 6 | azpdescr447v.stretchoid.com | 2 | 0 | 0.0 KB | 0 | 0 | 0 | 00:00:10 |
| 7 | azpdesmduyvf.stretchoid.com | 2 | 0 | 0.0 KB | 0 | 0 | 0 | 00:00:10 |
| 8 | 104.168.107.226 | 1 | 0 | 0.0 KB | 0 | 0 | 0 | 00:00:00 |
| 9 | 147.185.132.157 | 1 | 0 | 0.0 KB | 0 | 0 | 0 | 00:00:00 |
| 10 | 198.235.24.40 | 1 | 0 | 0.0 KB | 0 | 0 | 0 | 00:00:01 |
| 11 | 205.210.31.35 | 1 | 0 | 0.0 KB | 0 | 0 | 0 | 00:00:02 |
| 12 | 23.94.245.4 | 1 | 0 | 0.0 KB | 0 | 0 | 0 | 00:00:00 |
| 13 | 87.210.203.35.bc.googleusercontent.com | 1 | 0 | 0.0 KB | 0 | 0 | 0 | 00:00:00 |
| 14 | keziah.probe.onyphe.net | 1 | 0 | 0.0 KB | 0 | 0 | 0 | 00:00:03 |
| TOTAL: 14 | 26 | 0 | 0.0 KB | 0 | 0 | 0 | 00:01:16 | |
NNRP readership statistics (by domain):
| System | Conn | Arts | Size | Groups | Post | Rej | Elapsed | |
|---|---|---|---|---|---|---|---|---|
| 1 | unresolved | 11 | 0 | 0.0 KB | 0 | 0 | 0 | 00:00:11 |
| 2 | *.scanner.modat.io | 5 | 0 | 0.0 KB | 0 | 0 | 0 | 00:00:00 |
| 3 | *.stretchoid.com | 4 | 0 | 0.0 KB | 0 | 0 | 0 | 00:00:20 |
| 4 | *.150.216.162.bc.googleusercontent.com | 2 | 0 | 0.0 KB | 0 | 0 | 0 | 00:00:13 |
| 5 | *.211.203.35.bc.googleusercontent.com | 2 | 0 | 0.0 KB | 0 | 0 | 0 | 00:00:27 |
| 6 | *.210.203.35.bc.googleusercontent.com | 1 | 0 | 0.0 KB | 0 | 0 | 0 | 00:00:00 |
| 7 | *.probe.onyphe.net | 1 | 0 | 0.0 KB | 0 | 0 | 0 | 00:00:03 |
| TOTAL: 7 | 26 | 0 | 0.0 KB | 0 | 0 | 0 | 00:01:16 | |
NNRP total resource statistics [Top 20]:
| System | User(ms) | System(ms) | Idle(ms) | Elapsed |
|---|---|---|---|---|
| 48.211.203.35.bc.googleusercontent.com | 0.080 | 0.012 | 0.000 | 00:00:27 |
| 38.150.216.162.bc.googleusercontent.com | 0.082 | 0.009 | 0.000 | 00:00:13 |
| azpdescr447v.stretchoid.com | 0.016 | 0.008 | 0.000 | 00:00:10 |
| azpdesmduyvf.stretchoid.com | 0.013 | 0.010 | 0.000 | 00:00:10 |
| 167.94.146.61 | 0.055 | 0.014 | 0.000 | 00:00:03 |
| 162.142.125.37 | 0.056 | 0.018 | 0.000 | 00:00:03 |
| keziah.probe.onyphe.net | 0.041 | 0.004 | 0.000 | 00:00:03 |
| 205.210.31.35 | 0.008 | 0.005 | 0.000 | 00:00:02 |
| 198.235.24.40 | 0.008 | 0.005 | 0.000 | 00:00:01 |
| 147.185.132.157 | 0.046 | 0.016 | 0.000 | 00:00:00 |
| o312.scanner.modat.io | 0.202 | 0.019 | 0.000 | 00:00:00 |
| 87.210.203.35.bc.googleusercontent.com | 0.043 | 0.006 | 0.000 | 00:00:00 |
| 23.94.245.4 | 0.008 | 0.005 | 0.000 | 00:00:00 |
| 104.168.107.226 | 0.006 | 0.006 | 0.000 | 00:00:00 |
| TOTAL: 14 | 0.664 | 0.137 | 0.000 | 00:01:16 |
NNRP gethostbyaddr failures [Top 20]:
| System | Conn |
|---|---|
| ? (can't getpeername) | 11 |
| TOTAL: 1 | 11 |
NNRP unrecognized commands (by host) [Top 20]:
| System | Conn |
|---|---|
| 147.185.132.157 | 4 |
| 38.150.216.162.bc.googleusercontent.com | 4 |
| 48.211.203.35.bc.googleusercontent.com | 4 |
| 87.210.203.35.bc.googleusercontent.com | 4 |
| 162.142.125.37 | 1 |
| 167.94.146.61 | 1 |
| azpdescr447v.stretchoid.com | 1 |
| azpdesmduyvf.stretchoid.com | 1 |
| o312.scanner.modat.io | 1 |
| TOTAL: 9 | 21 |
NNRP unrecognized commands (by command) [Top 20]:
| Command | Count |
|---|---|
| GET / HTTP/1.1 | 4 |
| Host: 109.238.130.155:563 | 4 |
| Accept-Encoding: gzip | 2 |
| Accept: */* | 2 |
| EHLO www.censys.io | 2 |
| MGLNDD_109.238.130.155_119 | 2 |
| User-Agent: Hello from Palo Alto Network... | 2 |
| User-Agent: curl/7.68.0 | 2 |
| HELO | 1 |
| TOTAL: 9 | 21 |
NNRP client timeouts [Top 20]:
| System | Conn | Peer |
|---|---|---|
| 147.185.132.157 | 1 | 1 |
| 162.142.125.37 | 1 | 2 |
| 167.94.146.61 | 1 | 2 |
| 38.150.216.162.bc.googleusercontent.com | 1 | 2 |
| 48.211.203.35.bc.googleusercontent.com | 1 | 2 |
| 87.210.203.35.bc.googleusercontent.com | 1 | 1 |
| o312.scanner.modat.io | 1 | 1 |
| TOTAL: 7 | 7 | 14 |