Unknown entries from news log file:
First 1 / 1 lines (100.0%)
Log entries by program:
| Program name | Lines | %Lines | Size | %Size |
|---|---|---|---|---|
| inn | 256876 | 58.9% | 30.9 MB | 61.8% |
| innd | 176842 | 40.5% | 18.8 MB | 37.6% |
| innfeed | 2392 | 0.5% | 256.8 KB | 0.5% |
| nnrpd | 381 | 0.1% | 40.6 KB | 0.1% |
| controlchan | 1 | 0.0% | 0.1 KB | 0.0% |
| TOTAL: 5 | 436492 | 100.0% | 50.1 MB | 100.0% |
History cache:
| Reason | Count | %Count |
|---|---|---|
| Do not exist | 256433 | 50.1% |
| Negative hits | 253086 | 49.4% |
| Cache misses | 2483 | 0.5% |
| Positive hits | 262 | 0.1% |
| TOTAL: 4 | 512264 | 100.0% |
INND timer:
| Code region | Time | Pct | Invoked | Min(ms) | Avg(ms) | Max(ms) |
|---|---|---|---|---|---|---|
| article cancel | 00:00:00.017 | 0.0% | 13 | 0.000 | 1.308 | 14.000 |
| article cleanup | 00:00:01.004 | 0.0% | 256560 | 0.000 | 0.004 | 0.157 |
| article logging | 00:00:03.647 | 0.0% | 256732 | 0.000 | 0.014 | 0.207 |
| article parse | 00:00:02.357 | 0.0% | 770514 | 0.000 | 0.003 | 0.030 |
| article write | 00:02:15.744 | 0.2% | 88603 | 0.000 | 1.532 | 57.000 |
| artlog/artparse | 00:00:00.000 | 0.0% | 0 | 0.000 | 0.000 | 0.000 |
| artlog/artwrite | 00:00:00.000 | 0.0% | 0 | 0.000 | 0.000 | 0.000 |
| data move | 00:00:00.273 | 0.0% | 789734 | 0.000 | 0.000 | 0.006 |
| hisgrep/artcncl | 00:00:00.001 | 0.0% | 13 | 0.000 | 0.077 | 1.000 |
| hishave/artparse | 00:00:00.000 | 0.0% | 0 | 0.000 | 0.000 | 0.000 |
| hissync/artwrite | 00:00:00.000 | 0.0% | 0 | 0.000 | 0.000 | 0.000 |
| history grep | 00:00:00.000 | 0.0% | 0 | 0.000 | 0.000 | 0.000 |
| history lookup | 00:09:07.665 | 0.6% | 512580 | 0.000 | 1.068 | 21.000 |
| history sync | 00:00:00.009 | 0.0% | 306 | 0.000 | 0.029 | 1.000 |
| history write | 00:05:02.657 | 0.4% | 256560 | 0.000 | 1.180 | 12.309 |
| hiswrite/artparse | 00:00:00.000 | 0.0% | 0 | 0.000 | 0.000 | 0.000 |
| idle | 23:36:36.375 | 98.4% | 773669 | 40.395 | 109.861 | 60055.000 |
| nntp read | 00:00:05.898 | 0.0% | 773478 | 0.000 | 0.008 | 0.169 |
| overview write | 00:00:17.740 | 0.0% | 88603 | 0.000 | 0.200 | 16.223 |
| perl filter | 00:04:53.811 | 0.3% | 256560 | 0.328 | 1.145 | 54.000 |
| python filter | 00:00:12.294 | 0.0% | 512339 | 0.000 | 0.024 | 0.376 |
| site send | 00:00:00.810 | 0.0% | 88603 | 0.000 | 0.009 | 0.500 |
| TOTAL: 23:59:17.214 | 23:58:40.302 | 100.0% | - | - | - | - |
INNfeed timer:
| Code region | Time | Pct | Invoked | Min(ms) | Avg(ms) | Max(ms) |
|---|---|---|---|---|---|---|
| article new | 00:00:00.134 | 0.0% | 88817 | 0.000 | 0.002 | 0.071 |
| article prepare | 00:00:00.022 | 0.0% | 337660 | 0.000 | 0.000 | 0.008 |
| article read | 00:00:07.552 | 0.0% | 84415 | 0.000 | 0.089 | 1.396 |
| backlog stats | 00:00:00.114 | 0.0% | 432122 | 0.000 | 0.000 | 0.012 |
| callbacks | 00:00:00.000 | 0.0% | 0 | 0.000 | 0.000 | 0.000 |
| data read | 00:00:01.644 | 0.0% | 257947 | 0.000 | 0.006 | 0.081 |
| data write | 00:00:02.620 | 0.0% | 169393 | 0.000 | 0.015 | 0.094 |
| idle | 23:59:33.626 | 100.0% | 432122 | 64.734 | 199.883 | 30076.000 |
| status file | 00:00:00.267 | 0.0% | 203 | 0.000 | 1.315 | 62.000 |
| TOTAL: 23:59:50.318 | 23:59:45.979 | 100.0% | - | - | - | - |
nnrpd timer:
| Code region | Time | Pct | Invoked | Min(ms) | Avg(ms) | Max(ms) |
|---|---|---|---|---|---|---|
| idle | 00:00:36.702 | 23.1% | 24 | 66.500 | 1529.250 | 10050.000 |
| newnews | 00:00:00.000 | 0.0% | 0 | 0.000 | 0.000 | 0.000 |
| nntpwrite | 00:00:00.001 | 0.0% | 181 | 0.000 | 0.006 | 1.000 |
| readart | 00:00:00.010 | 0.0% | 2 | 5.000 | 5.000 | 5.000 |
| TOTAL: 00:02:38.712 | 00:00:36.713 | 23.1% | - | - | - | - |
Control commands to INND:
| Command | Number |
|---|---|
| flush | 2 |
| flushlogs | 2 |
| go | 2 |
| logmode | 2 |
| lowmark | 1 |
| mode | 145 |
| name | 2 |
| pause | 2 |
| paused | 2 |
| reload | 2 |
| reserve | 2 |
| TOTAL: 11 | 164 |
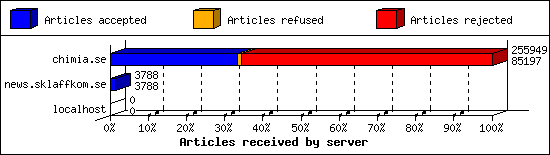
Incoming Feeds (INN):
| Server | Connects | Offered | Taken | Refused | Reject | %Accpt | Elapsed | |
|---|---|---|---|---|---|---|---|---|
| 1 | chimia.se | 1 | 255949 | 85197 | 2796 | 167956 | 33% | 23:55:56 |
| 2 | news.sklaffkom.se | 2 | 3788 | 3788 | 0 | 0 | 100% | 27:11:44 |
| 3 | localhost | 25 | 0 | 0 | 0 | 0 | 0% | 00:00:00 |
| TOTAL: 3 | 28 | 259737 | 88985 | 2796 | 167956 | 34% | 51:07:40 | |
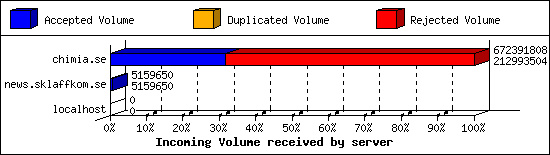
Incoming Volume (INN):
| Server | AcceptVol | DupVol | RejVol | TotalVol | %Acc | Vol/Art | |
|---|---|---|---|---|---|---|---|
| 1 | chimia.se | 203.1 MB | 0.0 KB | 438.1 MB | 641.2 MB | 31% | 2.6 KB |
| 2 | news.sklaffkom.se | 4.9 MB | 0.0 KB | 0.0 KB | 4.9 MB | 100% | 1.3 KB |
| 3 | localhost | 0.0 KB | 0.0 KB | 0.0 KB | 0.0 KB | 0% | 0 |
| TOTAL: 3 | 208.0 MB | 0.0 KB | 438.1 MB | 646.2 MB | 32% | 2.6 KB | |
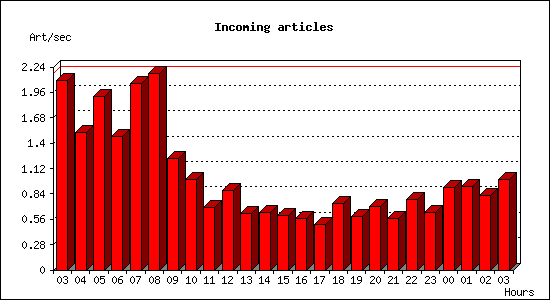
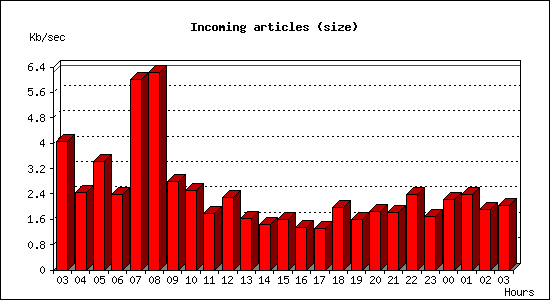
Incoming articles:
| Date | Articles | %Arts | Art/sec | Size | %Size | KB/sec |
|---|---|---|---|---|---|---|
| Jan 21 03:00:01 - 03:59:59 | 7536 | 8.5% | 2.09 | 14.2 MB | 6.8% | 4.04 |
| Jan 21 04:00:00 - 04:59:59 | 5468 | 6.2% | 1.52 | 8.6 MB | 4.1% | 2.44 |
| Jan 21 05:00:00 - 05:59:59 | 6893 | 7.8% | 1.91 | 12.1 MB | 5.8% | 3.43 |
| Jan 21 06:00:00 - 06:59:59 | 5306 | 6.0% | 1.47 | 8.4 MB | 4.0% | 2.39 |
| Jan 21 07:00:00 - 07:59:59 | 7416 | 8.4% | 2.06 | 21.1 MB | 10.2% | 5.99 |
| Jan 21 08:00:00 - 08:59:59 | 7798 | 8.8% | 2.17 | 21.9 MB | 10.6% | 6.23 |
| Jan 21 09:00:00 - 09:59:59 | 4434 | 5.0% | 1.23 | 9.8 MB | 4.7% | 2.78 |
| Jan 21 10:00:00 - 10:59:59 | 3578 | 4.0% | 0.99 | 8.8 MB | 4.3% | 2.51 |
| Jan 21 11:00:00 - 11:59:59 | 2496 | 2.8% | 0.69 | 6.2 MB | 3.0% | 1.77 |
| Jan 21 12:00:00 - 12:59:59 | 3150 | 3.6% | 0.88 | 8.0 MB | 3.9% | 2.28 |
| Jan 21 13:00:00 - 13:59:59 | 2262 | 2.6% | 0.63 | 5.7 MB | 2.7% | 1.62 |
| Jan 21 14:00:00 - 14:59:59 | 2291 | 2.6% | 0.64 | 5.1 MB | 2.4% | 1.44 |
| Jan 21 15:00:00 - 15:59:59 | 2150 | 2.4% | 0.60 | 5.6 MB | 2.7% | 1.60 |
| Jan 21 16:00:00 - 16:59:59 | 2058 | 2.3% | 0.57 | 4.8 MB | 2.3% | 1.36 |
| Jan 21 17:00:00 - 17:59:59 | 1795 | 2.0% | 0.50 | 4.6 MB | 2.2% | 1.31 |
| Jan 21 18:00:00 - 18:59:59 | 2631 | 3.0% | 0.73 | 6.9 MB | 3.3% | 1.96 |
| Jan 21 19:00:00 - 19:59:59 | 2133 | 2.4% | 0.59 | 5.6 MB | 2.7% | 1.59 |
| Jan 21 20:00:00 - 20:59:59 | 2537 | 2.9% | 0.70 | 6.5 MB | 3.1% | 1.85 |
| Jan 21 21:00:00 - 21:59:59 | 2052 | 2.3% | 0.57 | 6.4 MB | 3.1% | 1.82 |
| Jan 21 22:00:00 - 22:59:59 | 2807 | 3.2% | 0.78 | 8.4 MB | 4.1% | 2.39 |
| Jan 21 23:00:00 - 23:59:59 | 2275 | 2.6% | 0.63 | 6.0 MB | 2.9% | 1.70 |
| Jan 22 00:00:00 - 00:59:59 | 3282 | 3.7% | 0.91 | 7.8 MB | 3.8% | 2.22 |
| Jan 22 01:00:00 - 01:59:59 | 3330 | 3.8% | 0.93 | 8.3 MB | 4.0% | 2.37 |
| Jan 22 02:00:00 - 02:59:59 | 2967 | 3.3% | 0.82 | 6.7 MB | 3.2% | 1.91 |
| Jan 22 03:00:00 - 03:00:01 | 1 | 0.0% | 1.00 | 2.0 KB | 0.0% | 2.02 |
| TOTAL: 24:00:00 | 88646 | 100.0% | 1.03 | 207.4 MB | 100.0% | 2.46 |
Sites sending bad articles:
| Server | Total | Group | Dist | Duplic | Unapp | TooOld | Site | Line | Other | |
|---|---|---|---|---|---|---|---|---|---|---|
| 1 | chimia.se | 168230 | 0 | 0 | 0 | 2 | 0 | 0 | 0 | 168228 |
| TOTAL: 1 | 168230 | 0 | 0 | 0 | 2 | 0 | 0 | 0 | 168228 | |
Supposedly-moderated groups with unmoderated postings [Top 20]:
| Groups | Count |
|---|---|
| news.newusers.questions | 2 |
| TOTAL: 1 | 2 |
INND Perl filter [Top 20]:
| Reason | Count |
|---|---|
| EMP (phn path) | 95732 |
| EMP (phn nph) | 47967 |
| EMP (phl) | 23066 |
| EMP (md5) | 782 |
| HTML Multipart | 290 |
| Subject Rejected | 85 |
| Binary: misplaced binary | 36 |
| MI5 Filter | 34 |
| Scoring filter | 19 |
| Too many newsgroups (meow) | 11 |
| Too many newsgroups | 10 |
| Binary Image: misplaced jpg | 6 |
| Binary Image: misplaced gif | 5 |
| HTML post | 5 |
| Too many newsgroups (low_xpost) | 2 |
| hierarchy violation - crosspost outside sdnet | 2 |
| HTML file attachment | 1 |
| NewsAgent | 1 |
| PFM bot misc | 1 |
| TOTAL: 19 | 168055 |
Miscellaneous innd statistics [Top 10]:
| Event | Server | Number |
|---|---|---|
| Bad Message-ID's offered | ||
| chimia.se | 29 | |
| TOTAL: 1 | 29 | |
| Including strange strings | ||
| chimia.se | 173 | |
| TOTAL: 1 | 173 | |
| TOTAL: 2 | 202 | |
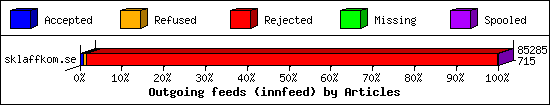
Outgoing Feeds (innfeed) by Articles:
| Server | Offered | Taken | Refused | Reject | Miss | Spool | %Took | Elapsed | |
|---|---|---|---|---|---|---|---|---|---|
| 1 | sklaffkom.se | 85122 | 715 | 675 | 83712 | 0 | 183 | 0% | 23:59:57 |
| 2 | sklaff.dev | 0 | 0 | 0 | 0 | 0 | 88644 | 0% | 23:57:42 |
| 3 | thebunker.nu | 0 | 0 | 0 | 0 | 0 | 88644 | 0% | 23:59:57 |
| 4 | usenet.blueworldhosting.com | 0 | 0 | 0 | 0 | 0 | 60639 | 0% | 23:59:57 |
| TOTAL: 4 | 85122 | 715 | 675 | 83712 | 0 | 238110 | 0% | 95:57:33 | |
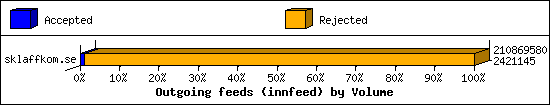
Outgoing Feeds (innfeed) by Volume:
| Server | AcceptVol | RejectVol | TotalVol | Volume/sec | Vol/Art | Elapsed | |
|---|---|---|---|---|---|---|---|
| 1 | sklaffkom.se | 2.3 MB | 198.8 MB | 201.1 MB | 2.4 KB/s | 2.4 KB | 23:59:57 |
| 2 | sklaff.dev | 0.0 KB | 0.0 KB | 0.0 KB | 0.0 KB/s | 0 | 23:57:42 |
| 3 | thebunker.nu | 0.0 KB | 0.0 KB | 0.0 KB | 0.0 KB/s | 0 | 23:59:57 |
| 4 | usenet.blueworldhosting.com | 0.0 KB | 0.0 KB | 0.0 KB | 0.0 KB/s | 0 | 23:59:57 |
| TOTAL: 4 | 2.3 MB | 198.8 MB | 201.1 MB | 0.6 KB/s | 2.4 KB | 95:57:33 | |
NNRP readership statistics:
| System | Conn | Arts | Size | Groups | Post | Rej | Elapsed | |
|---|---|---|---|---|---|---|---|---|
| 1 | 66.61.98.95 | 2 | 2 | 4.1 KB | 1 | 0 | 0 | 00:00:16 |
| TOTAL: 1 | 2 | 2 | 4.1 KB | 1 | 0 | 0 | 00:02:38 | |
NNRP readership statistics (by domain):
| System | Conn | Arts | Size | Groups | Post | Rej | Elapsed | |
|---|---|---|---|---|---|---|---|---|
| 1 | unresolved | 11 | 2 | 4.1 KB | 1 | 0 | 0 | 00:00:48 |
| 2 | *.ip.linodeusercontent.com | 59 | 0 | 0.0 KB | 0 | 0 | 0 | 00:01:07 |
| 3 | *.monitoring.internet-measurement.com | 8 | 0 | 0.0 KB | 0 | 0 | 0 | 00:00:08 |
| 4 | *.scanner.modat.io | 5 | 0 | 0.0 KB | 0 | 0 | 0 | 00:00:00 |
| 5 | *.150.216.162.bc.googleusercontent.com | 2 | 0 | 0.0 KB | 0 | 0 | 0 | 00:00:18 |
| 6 | *.stretchoid.com | 2 | 0 | 0.0 KB | 0 | 0 | 0 | 00:00:10 |
| 7 | *.34.168.206.censys-scanner.com | 1 | 0 | 0.0 KB | 0 | 0 | 0 | 00:00:05 |
| TOTAL: 7 | 88 | 2 | 4.1 KB | 1 | 0 | 0 | 00:02:38 | |
NNRP total resource statistics [Top 20]:
| System | User(ms) | System(ms) | Idle(ms) | Elapsed |
|---|---|---|---|---|
| 172-104-30-66.ip.linodeusercontent.com | 1.668 | 0.164 | 0.000 | 00:01:07 |
| 147.185.133.71 | 0.086 | 0.009 | 0.000 | 00:00:23 |
| 223.150.216.162.bc.googleusercontent.com | 0.081 | 0.008 | 0.000 | 00:00:18 |
| 66.61.98.95 | 0.019 | 0.017 | 0.000 | 00:00:16 |
| azpdsgqlmhw6.stretchoid.com | 0.016 | 0.006 | 0.000 | 00:00:10 |
| 115.34.168.206.censys-scanner.com | 0.039 | 0.007 | 0.000 | 00:00:05 |
| 205.210.31.243 | 0.005 | 0.006 | 0.000 | 00:00:04 |
| plentiful.monitoring.internet-measurement.com | 0.040 | 0.003 | 0.000 | 00:00:03 |
| groundbreaking.monitoring.internet-measurement.com | 0.042 | 0.003 | 0.000 | 00:00:03 |
| 205.210.31.206 | 0.007 | 0.004 | 0.000 | 00:00:02 |
| cheerful.monitoring.internet-measurement.com | 0.008 | 0.003 | 0.000 | 00:00:01 |
| 152.32.201.130 | 0.006 | 0.007 | 0.000 | 00:00:00 |
| 23.95.246.237 | 0.011 | 0.014 | 0.000 | 00:00:00 |
| o303.scanner.modat.io | 0.191 | 0.024 | 0.000 | 00:00:00 |
| 147.185.133.180 | 0.043 | 0.002 | 0.000 | 00:00:00 |
| 147.185.133.255 | 0.043 | 0.002 | 0.000 | 00:00:00 |
| powerful.monitoring.internet-measurement.com | 0.037 | 0.006 | 0.000 | 00:00:00 |
| productive.monitoring.internet-measurement.com | 0.039 | 0.005 | 0.000 | 00:00:00 |
| humble.monitoring.internet-measurement.com | 0.038 | 0.005 | 0.000 | 00:00:00 |
| TOTAL: 19 | 2.419 | 0.295 | 0.000 | 00:02:38 |
Curious NNRP server explorers [Top 20]:
| System | Conn |
|---|---|
| 172-104-30-66.ip.linodeusercontent.com | 59 |
| o303.scanner.modat.io | 5 |
| 147.185.133.71 | 2 |
| 223.150.216.162.bc.googleusercontent.com | 2 |
| 23.95.246.237 | 2 |
| azpdsgqlmhw6.stretchoid.com | 2 |
| humble.monitoring.internet-measurement.com | 2 |
| 115.34.168.206.censys-scanner.com | 1 |
| 147.185.133.180 | 1 |
| 147.185.133.255 | 1 |
| 152.32.201.130 | 1 |
| 205.210.31.206 | 1 |
| 205.210.31.243 | 1 |
| cheerful.monitoring.internet-measurement.com | 1 |
| groundbreaking.monitoring.internet-measurement.com | 1 |
| plentiful.monitoring.internet-measurement.com | 1 |
| powerful.monitoring.internet-measurement.com | 1 |
| productive.monitoring.internet-measurement.com | 1 |
| satisfying.monitoring.internet-measurement.com | 1 |
| TOTAL: 19 | 86 |
NNRP gethostbyaddr failures [Top 20]:
| System | Conn |
|---|---|
| ? (can't getpeername) | 15 |
| TOTAL: 1 | 15 |
NNRP unrecognized commands (by host) [Top 20]:
| System | Conn |
|---|---|
| 152.32.201.130 | 6 |
| 147.185.133.180 | 4 |
| 147.185.133.255 | 4 |
| 147.185.133.71 | 4 |
| 223.150.216.162.bc.googleusercontent.com | 4 |
| 115.34.168.206.censys-scanner.com | 1 |
| azpdsgqlmhw6.stretchoid.com | 1 |
| o303.scanner.modat.io | 1 |
| TOTAL: 8 | 25 |
NNRP unrecognized commands (by command) [Top 20]:
| Command | Count |
|---|---|
| GET / HTTP/1.1 | 5 |
| Host: 109.238.130.155:563 | 4 |
| Accept: */* | 3 |
| Accept-Encoding: gzip | 2 |
| User-Agent: Hello from Palo Alto Network... | 2 |
| User-Agent: curl/7.68.0 | 2 |
| Accept-Language: zh-CN,zh;q=0.9,zh-TW;q=... | 1 |
| Connection: Close | 1 |
| EHLO www.censys.io | 1 |
| HELO | 1 |
| Host: 109.238.130.155:119 | 1 |
| MGLNDD_109.238.130.155_119 | 1 |
| User-Agent: Mozilla/5.0 (Windows NT 10.0... | 1 |
| TOTAL: 13 | 25 |
NNRP client timeouts [Top 20]:
| System | Conn | Peer |
|---|---|---|
| 147.185.133.180 | 1 | 1 |
| 147.185.133.255 | 1 | 1 |
| 147.185.133.71 | 1 | 2 |
| 223.150.216.162.bc.googleusercontent.com | 1 | 2 |
| o303.scanner.modat.io | 1 | 1 |
| TOTAL: 5 | 5 | 12 |
Newsgroup request counts (by hierarchy):
| Hierarchy | Count | Pct | |
|---|---|---|---|
| 1 | alt | 2 | 100.0% |
| TOTAL: 1 | 2 | 100.0% | |
Newsgroup request counts (by newsgroup) [Top 100]:
| Newsgroup | Count | |
|---|---|---|
| 1 | alt.netscape.buggy-products | 2 |
| TOTAL: 1 | 2 | |