Unknown entries from news log file:
First 1 / 1 lines (100.0%)
Log entries by program:
| Program name | Lines | %Lines | Size | %Size |
|---|---|---|---|---|
| innd | 6010 | 44.2% | 1012.3 KB | 49.7% |
| inn | 4123 | 30.3% | 741.4 KB | 36.4% |
| innfeed | 2118 | 15.6% | 173.6 KB | 8.5% |
| nnrpd | 1336 | 9.8% | 108.3 KB | 5.3% |
| controlchan | 1 | 0.0% | 0.1 KB | 0.0% |
| TOTAL: 5 | 13588 | 100.0% | 2.0 MB | 100.0% |
History cache:
| Reason | Count | %Count |
|---|---|---|
| Do not exist | 4112 | 93.2% |
| Negative hits | 300 | 6.8% |
| Positive hits | 0 | 0.0% |
| Cache misses | 0 | 0.0% |
| TOTAL: 4 | 4412 | 100.0% |
INND timer:
| Code region | Time | Pct | Invoked | Min(ms) | Avg(ms) | Max(ms) |
|---|---|---|---|---|---|---|
| article cancel | 00:00:00.021 | 0.0% | 2 | 0.000 | 10.500 | 21.000 |
| article cleanup | 00:00:00.014 | 0.0% | 4112 | 0.000 | 0.003 | 1.000 |
| article logging | 00:00:00.036 | 0.0% | 4123 | 0.000 | 0.009 | 1.000 |
| article parse | 00:00:00.030 | 0.0% | 4636 | 0.000 | 0.006 | 1.000 |
| article write | 00:00:01.843 | 0.0% | 4108 | 0.000 | 0.449 | 49.000 |
| data move | 00:00:00.002 | 0.0% | 5449 | 0.000 | 0.000 | 0.167 |
| hisgrep/artcncl | 00:00:00.001 | 0.0% | 2 | 0.000 | 0.500 | 1.000 |
| history grep | 00:00:00.000 | 0.0% | 0 | 0.000 | 0.000 | 0.000 |
| history lookup | 00:00:23.976 | 0.0% | 4412 | 0.000 | 5.434 | 38.000 |
| history sync | 00:00:00.032 | 0.0% | 1683 | 0.000 | 0.019 | 6.000 |
| history write | 00:00:11.387 | 0.0% | 4112 | 0.000 | 2.769 | 41.000 |
| idle | 23:59:08.520 | 99.9% | 6600 | 1001.183 | 13083.109 | 60061.000 |
| nntp read | 00:00:00.050 | 0.0% | 4950 | 0.000 | 0.010 | 1.000 |
| overview write | 00:00:01.744 | 0.0% | 4108 | 0.000 | 0.425 | 183.500 |
| perl filter | 00:00:06.217 | 0.0% | 4112 | 0.000 | 1.512 | 36.000 |
| python filter | 00:00:00.128 | 0.0% | 4112 | 0.000 | 0.031 | 1.000 |
| site send | 00:00:00.045 | 0.0% | 4101 | 0.000 | 0.011 | 1.000 |
| TOTAL: 23:59:56.183 | 23:59:54.046 | 100.0% | - | - | - | - |
INNfeed timer:
| Code region | Time | Pct | Invoked | Min(ms) | Avg(ms) | Max(ms) |
|---|---|---|---|---|---|---|
| article new | 00:00:00.006 | 0.0% | 4101 | 0.000 | 0.001 | 0.500 |
| article prepare | 00:00:00.000 | 0.0% | 0 | 0.000 | 0.000 | 0.000 |
| article read | 00:00:00.000 | 0.0% | 0 | 0.000 | 0.000 | 0.000 |
| backlog stats | 00:00:00.009 | 0.0% | 8645 | 0.000 | 0.001 | 0.250 |
| callbacks | 00:00:00.000 | 0.0% | 0 | 0.000 | 0.000 | 0.000 |
| data read | 00:00:00.034 | 0.0% | 4156 | 0.000 | 0.008 | 1.000 |
| data write | 00:00:00.000 | 0.0% | 92 | 0.000 | 0.000 | 0.000 |
| idle | 23:59:57.795 | 100.0% | 8645 | 1055.386 | 9993.961 | 30100.500 |
| status file | 00:00:00.075 | 0.0% | 196 | 0.000 | 0.383 | 23.000 |
| TOTAL: 23:59:58.213 | 23:59:57.919 | 100.0% | - | - | - | - |
nnrpd timer:
| Code region | Time | Pct | Invoked | Min(ms) | Avg(ms) | Max(ms) |
|---|---|---|---|---|---|---|
| idle | 00:02:51.721 | 98.7% | 1238 | 24.000 | 138.708 | 10041.000 |
| newnews | 00:00:00.000 | 0.0% | 0 | 0.000 | 0.000 | 0.000 |
| nntpwrite | 00:00:00.019 | 0.0% | 2536 | 0.000 | 0.007 | 0.500 |
| TOTAL: 00:02:54.059 | 00:02:51.740 | 98.7% | - | - | - | - |
Control commands to INND:
| Command | Number |
|---|---|
| flush | 2 |
| flushlogs | 2 |
| go | 2 |
| logmode | 2 |
| lowmark | 1 |
| mode | 145 |
| name | 2 |
| pause | 2 |
| paused | 2 |
| reload | 2 |
| reserve | 2 |
| TOTAL: 11 | 164 |
Incoming Feeds (INN):
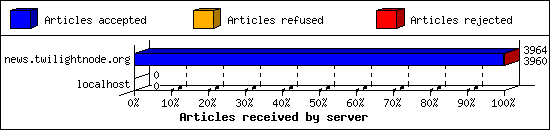
| Server | Connects | Offered | Taken | Refused | Reject | %Accpt | Elapsed | |
|---|---|---|---|---|---|---|---|---|
| 1 | news.twilightnode.org | 3 | 3964 | 3960 | 0 | 4 | 99% | 22:42:54 |
| 2 | localhost | 25 | 0 | 0 | 0 | 0 | 0% | 00:00:00 |
| TOTAL: 2 | 28 | 3964 | 3960 | 0 | 4 | 99% | 22:42:54 | |
Incoming Volume (INN):
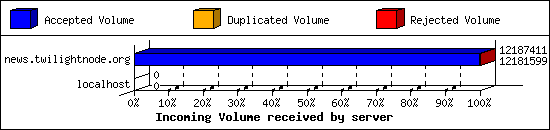
| Server | AcceptVol | DupVol | RejVol | TotalVol | %Acc | Vol/Art | |
|---|---|---|---|---|---|---|---|
| 1 | news.twilightnode.org | 11.6 MB | 0.0 KB | 5.7 KB | 11.6 MB | 99% | 3.0 KB |
| 2 | localhost | 0.0 KB | 0.0 KB | 0.0 KB | 0.0 KB | 0% | 0 |
| TOTAL: 2 | 11.6 MB | 0.0 KB | 5.7 KB | 11.6 MB | 99% | 3.0 KB | |
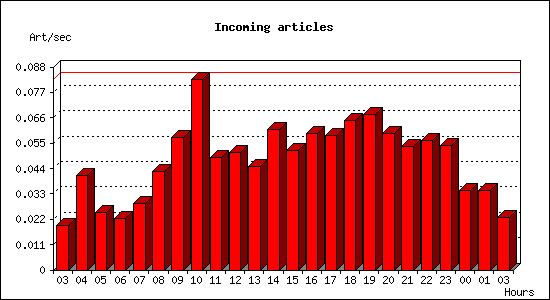
Incoming articles:
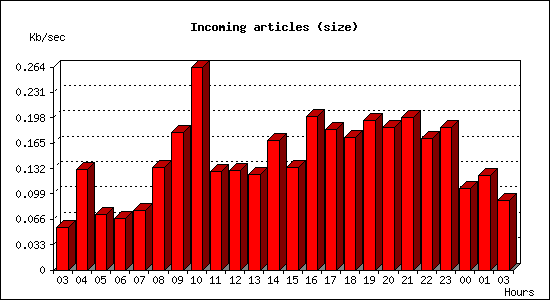
| Date | Articles | %Arts | Art/sec | Size | %Size | KB/sec |
|---|---|---|---|---|---|---|
| Jun 23 03:00:01 - 03:59:59 | 69 | 1.7% | 0.02 | 200.4 KB | 1.6% | 0.06 |
| Jun 23 04:00:00 - 04:59:59 | 148 | 3.6% | 0.04 | 471.4 KB | 3.8% | 0.13 |
| Jun 23 05:00:00 - 05:59:59 | 90 | 2.2% | 0.03 | 260.4 KB | 2.1% | 0.07 |
| Jun 23 06:00:00 - 06:59:59 | 80 | 1.9% | 0.02 | 242.2 KB | 1.9% | 0.07 |
| Jun 23 07:00:00 - 07:59:59 | 103 | 2.5% | 0.03 | 279.9 KB | 2.2% | 0.08 |
| Jun 23 08:00:00 - 08:59:59 | 154 | 3.7% | 0.04 | 481.5 KB | 3.9% | 0.13 |
| Jun 23 09:00:00 - 09:59:59 | 207 | 5.0% | 0.06 | 643.1 KB | 5.1% | 0.18 |
| Jun 23 10:00:00 - 10:59:59 | 298 | 7.3% | 0.08 | 948.2 KB | 7.6% | 0.26 |
| Jun 23 11:00:00 - 11:59:59 | 175 | 4.3% | 0.05 | 459.9 KB | 3.7% | 0.13 |
| Jun 23 12:00:00 - 12:59:59 | 184 | 4.5% | 0.05 | 464.6 KB | 3.7% | 0.13 |
| Jun 23 13:00:00 - 13:59:59 | 162 | 3.9% | 0.04 | 446.4 KB | 3.6% | 0.12 |
| Jun 23 14:00:00 - 14:59:59 | 220 | 5.4% | 0.06 | 607.0 KB | 4.9% | 0.17 |
| Jun 23 15:00:00 - 15:59:59 | 186 | 4.5% | 0.05 | 480.0 KB | 3.8% | 0.13 |
| Jun 23 16:00:00 - 16:59:59 | 213 | 5.2% | 0.06 | 716.5 KB | 5.7% | 0.20 |
| Jun 23 17:00:00 - 17:59:59 | 210 | 5.1% | 0.06 | 656.4 KB | 5.3% | 0.18 |
| Jun 23 18:00:00 - 18:59:59 | 234 | 5.7% | 0.07 | 618.7 KB | 5.0% | 0.17 |
| Jun 23 19:00:00 - 19:59:59 | 242 | 5.9% | 0.07 | 699.4 KB | 5.6% | 0.19 |
| Jun 23 20:00:00 - 20:59:59 | 213 | 5.2% | 0.06 | 665.5 KB | 5.3% | 0.18 |
| Jun 23 21:00:00 - 21:59:59 | 193 | 4.7% | 0.05 | 715.5 KB | 5.7% | 0.20 |
| Jun 23 22:00:00 - 22:59:59 | 202 | 4.9% | 0.06 | 616.4 KB | 4.9% | 0.17 |
| Jun 23 23:00:00 - 23:59:59 | 195 | 4.7% | 0.05 | 667.6 KB | 5.3% | 0.19 |
| Jun 24 00:00:00 - 00:59:59 | 124 | 3.0% | 0.03 | 383.0 KB | 3.1% | 0.11 |
| Jun 24 01:00:00 - 01:59:59 | 124 | 3.0% | 0.03 | 441.7 KB | 3.5% | 0.12 |
| Jun 24 02:00:00 - 03:00:01 | 82 | 2.0% | 0.02 | 326.2 KB | 2.6% | 0.09 |
| TOTAL: 24:00:00 | 4108 | 100.0% | 0.05 | 12.2 MB | 100.0% | 0.14 |
Sites sending bad articles:
| Server | Total | Group | Dist | Duplic | Unapp | TooOld | Site | Line | Other | |
|---|---|---|---|---|---|---|---|---|---|---|
| 1 | news.twilightnode.org | 15 | 0 | 0 | 0 | 0 | 0 | 0 | 0 | 15 |
| TOTAL: 1 | 15 | 0 | 0 | 0 | 0 | 0 | 0 | 0 | 15 | |
INND Perl filter [Top 20]:
| Reason | Count |
|---|---|
| EMP (md5) | 4 |
| TOTAL: 1 | 4 |
Miscellaneous innd statistics [Top 10]:
| Event | Server | Number |
|---|---|---|
| Including strange strings | ||
| news.twilightnode.org | 11 | |
| TOTAL: 1 | 11 | |
| TOTAL: 1 | 11 | |
Outgoing Feeds (innfeed) by Articles:
| Server | Offered | Taken | Refused | Reject | Miss | Spool | %Took | Elapsed | |
|---|---|---|---|---|---|---|---|---|---|
| 1 | sklaffkom.se | 0 | 0 | 0 | 0 | 0 | 4101 | 0% | 23:59:58 |
| 2 | thebunker.nu | 0 | 0 | 0 | 0 | 0 | 4101 | 0% | 23:57:46 |
| 3 | twilightnode.org | 0 | 0 | 0 | 0 | 0 | 0 | 0% | 00:10:00 |
| 4 | usenet.blueworldhosting.com | 0 | 0 | 0 | 0 | 0 | 3876 | 0% | 23:59:58 |
| TOTAL: 4 | 0 | 0 | 0 | 0 | 0 | 12078 | 0% | 72:07:42 | |
Outgoing Feeds (innfeed) by Volume:
| Server | AcceptVol | RejectVol | TotalVol | Volume/sec | Vol/Art | Elapsed | |
|---|---|---|---|---|---|---|---|
| 1 | sklaffkom.se | 0.0 KB | 0.0 KB | 0.0 KB | 0.0 KB/s | 0 | 23:59:58 |
| 2 | thebunker.nu | 0.0 KB | 0.0 KB | 0.0 KB | 0.0 KB/s | 0 | 23:57:46 |
| 3 | twilightnode.org | 0.0 KB | 0.0 KB | 0.0 KB | 0.0 KB/s | 0 | 00:10:00 |
| 4 | usenet.blueworldhosting.com | 0.0 KB | 0.0 KB | 0.0 KB | 0.0 KB/s | 0 | 23:59:58 |
| TOTAL: 4 | 0.0 KB | 0.0 KB | 0.0 KB | 0.0 KB/s | 0 | 72:07:42 | |
NNRP readership statistics:
| System | Conn | Arts | Size | Groups | Post | Rej | Elapsed | |
|---|---|---|---|---|---|---|---|---|
| 1 | 66.61.98.95 | 24 | 0 | 0.0 KB | 0 | 0 | 0 | 00:02:34 |
| 2 | 58.146.94.167.censys-scanner.com | 3 | 0 | 0.0 KB | 0 | 0 | 0 | 00:00:03 |
| 3 | azpdsgn0mjzi.stretchoid.com | 2 | 0 | 0.0 KB | 0 | 0 | 0 | 00:00:10 |
| 4 | 205.210.31.207 | 1 | 0 | 0.0 KB | 0 | 0 | 0 | 00:00:00 |
| 5 | greene.probe.onyphe.net | 1 | 0 | 0.0 KB | 0 | 0 | 0 | 00:00:02 |
| 6 | olson.probe.onyphe.net | 1 | 0 | 0.0 KB | 0 | 0 | 0 | 00:00:00 |
| 7 | r4-198-c6.monitoring.internet-measurement.com | 1 | 0 | 0.0 KB | 0 | 0 | 0 | 00:00:01 |
| TOTAL: 7 | 33 | 0 | 0.0 KB | 0 | 0 | 0 | 00:02:54 | |
NNRP readership statistics (by domain):
| System | Conn | Arts | Size | Groups | Post | Rej | Elapsed | |
|---|---|---|---|---|---|---|---|---|
| 1 | unresolved | 25 | 0 | 0.0 KB | 0 | 0 | 0 | 00:02:35 |
| 2 | *.146.94.167.censys-scanner.com | 3 | 0 | 0.0 KB | 0 | 0 | 0 | 00:00:03 |
| 3 | *.probe.onyphe.net | 2 | 0 | 0.0 KB | 0 | 0 | 0 | 00:00:03 |
| 4 | *.stretchoid.com | 2 | 0 | 0.0 KB | 0 | 0 | 0 | 00:00:10 |
| 5 | *.monitoring.internet-measurement.com | 1 | 0 | 0.0 KB | 0 | 0 | 0 | 00:00:01 |
| TOTAL: 5 | 33 | 0 | 0.0 KB | 0 | 0 | 0 | 00:02:54 | |
NNRP total resource statistics [Top 20]:
| System | User(ms) | System(ms) | Idle(ms) | Elapsed |
|---|---|---|---|---|
| 66.61.98.95 | 0.183 | 0.155 | 0.000 | 00:02:34 |
| azpdsgn0mjzi.stretchoid.com | 0.013 | 0.010 | 0.000 | 00:00:10 |
| 58.146.94.167.censys-scanner.com | 0.052 | 0.012 | 0.000 | 00:00:03 |
| greene.probe.onyphe.net | 0.005 | 0.005 | 0.000 | 00:00:02 |
| r4-198-c6.monitoring.internet-measurement.com | 0.006 | 0.006 | 0.000 | 00:00:01 |
| olson.probe.onyphe.net | 0.006 | 0.005 | 0.000 | 00:00:00 |
| 205.210.31.207 | 0.007 | 0.004 | 0.000 | 00:00:00 |
| TOTAL: 7 | 0.272 | 0.197 | 0.000 | 00:02:54 |
NNRP gethostbyaddr failures [Top 20]:
| System | Conn |
|---|---|
| ? (can't getpeername) | 1 |
| TOTAL: 1 | 1 |
NNRP unrecognized commands (by host) [Top 20]:
| System | Conn |
|---|---|
| olson.probe.onyphe.net | 2 |
| 58.146.94.167.censys-scanner.com | 1 |
| azpdsgn0mjzi.stretchoid.com | 1 |
| TOTAL: 3 | 4 |
NNRP unrecognized commands (by command) [Top 20]:
| Command | Count |
|---|---|
| #026#003#003#002d#001 | 1 |
| EHLO www.censys.io | 1 |
| MGLNDD_109.238.130.155_119 | 1 |
| À$ÀÀ¯À,ÀrÀsÌ©#023#002#023#001Ì#024À#007À#022À#023À'À/À#024À(À0À`Àa... | 1 |
| TOTAL: 4 | 4 |
NNRP client timeouts [Top 20]:
| System | Conn | Peer |
|---|---|---|
| 58.146.94.167.censys-scanner.com | 1 | 2 |
| TOTAL: 1 | 1 | 3 |